


DARIN · NEGOTIATE

Not “your price is too high.” Here is the calculation.

A target price per part, built from material, machine, labour and setup time — with the cost drivers that explain the gap. The kind of number that holds up when a supplier pushes back.

THE NEGOTIATE LEVER

Evidence per part, not a percentage per category.

6.5% Average savings potential identified*
33% Price influence from quantity in one turned-parts category
Per Part Target price, gap and driver evidence
€1B+ Analyzed spend across 250+ categories

Identified is not realised. We say which one we mean.

Most cost-savings numbers fall apart because five different things get called “savings”. DARIN quantifies the first two rungs and prepares the evidence for the third. The last two are earned in your contracts and your P&L — not in an analysis.

DARIN quantifies rungs 1 and 2. Rungs 3 to 5 are your negotiation, your contract, your books.

Prepare a negotiation
01 Identified

Theoretical cost potential

The gap between what you pay today and what the calculation says the part should cost, before anyone asks whether it is achievable. This is the number most savings claims quote — including ours, which is why we label it.

20%

DARIN calculates

02 Negotiable

What is actually addressable

The identified gap filtered by reality: which levers apply to this part, whether the quantity structure can change, whether an alternative process or location is feasible, what the supplier's own cost structure allows.

40%

DARIN calculates

03 Confirmed

Supplier-confirmed savings

The supplier accepts the logic and a new price. This happens in your negotiation. Our part is the evidence you take into it: the breakdown, the drivers, the scenarios and the questions worth asking.

60%

Your negotiation

04 Contracted

Contracted savings

The new price, quantity commitment or index clause is in the agreement. Until this point nothing has changed commercially, no matter how good the analysis was.

80%

Purchasing

05 Realised

Realised in the P&L

Parts are delivered and invoiced at the new price. Separately from this ladder sits cost avoidance — savings from design decisions that were never a price reduction, because the expensive version was never built.

100%

Controlling

The quantity lever

Your annual demand is not what the supplier prices.

Setup cost is charged per production run, not per year. That is why the same annual volume can produce two very different piece prices — and why bundling is the lever that costs nothing in quality or delivery reliability.

Per run
Setup cost is allocated per batch
Per piece
What the allocation does to the price
01
Order quantity, not annual quantity
A supplier setting up four times a year for 250 pieces prices differently from one setting up once for 1,000. The annual figure in your ERP does not tell you which of those you are buying.
Stacks of identical turned parts in increasing batch sizes
02
Lot size and call-off pattern
Framework agreement with call-offs, or repeated single orders? The pattern determines how often setup is charged and how much stock somebody has to carry in between.
03
Setup allocation
Setup time is calculated once and divided across the batch. Doubling the batch halves that share of the piece price — visible in the calculation as its own line, not buried in a rate.
04
Cross-site and cross-period bundling
Two plants buying the same part from the same supplier under separate orders is the most common avoidable case. Bundling changes the price without touching the part, the process or the supplier.
05
Economic order quantity, honestly calculated
Bigger batches lower the setup share and raise inventory and working capital cost. The point is the balance, not the maximum — and both sides of it belong in the same calculation.
06
Capacity and commitment
A volume commitment is worth something to a supplier planning capacity. That is a negotiable asset, and it is quantifiable before you offer it.
The lot-size effect

Same part, same process, same supplier — one number changed.

The lot-size calculator recalculates the whole cost stack for a different batch size. Nothing about the part, the process or the plant changes; the setup simply stops being carried by a single piece. This is the lever that costs nothing in quality or delivery reliability.

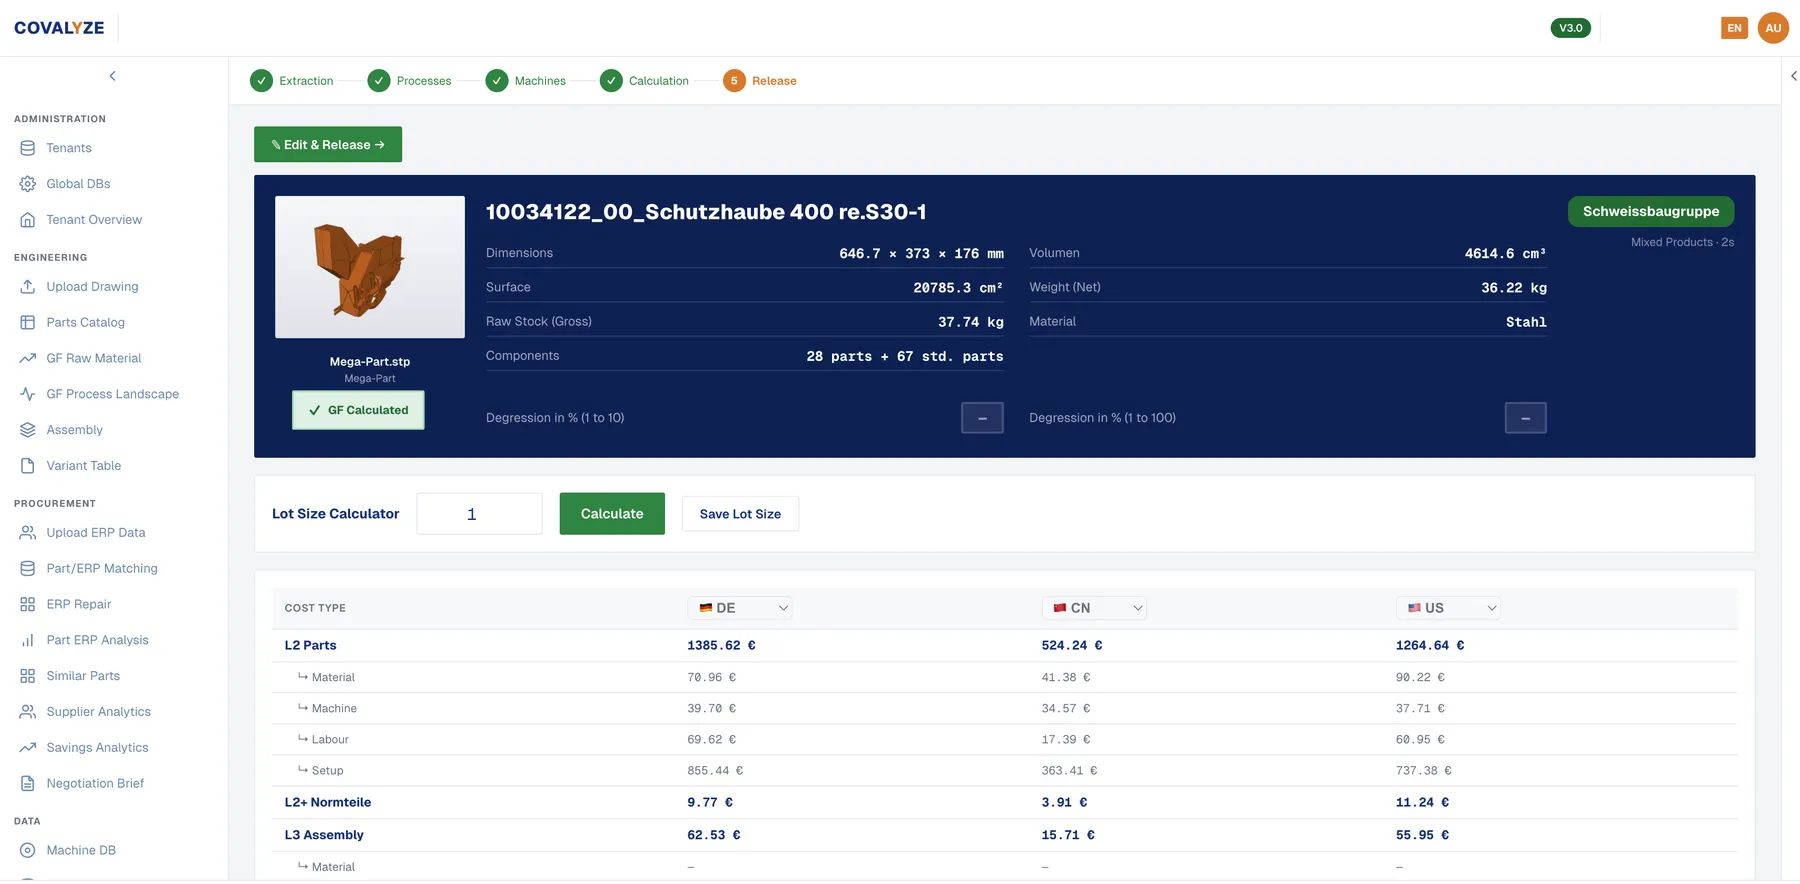
Lot size 1 Product view
DARIN should-cost view for a welded assembly at lot size 1, with the per-country cost table
A 28-component welded assembly at lot size 1: the German total lands at 1,457.92 €, with 855.44 € of it setup on the made parts alone.
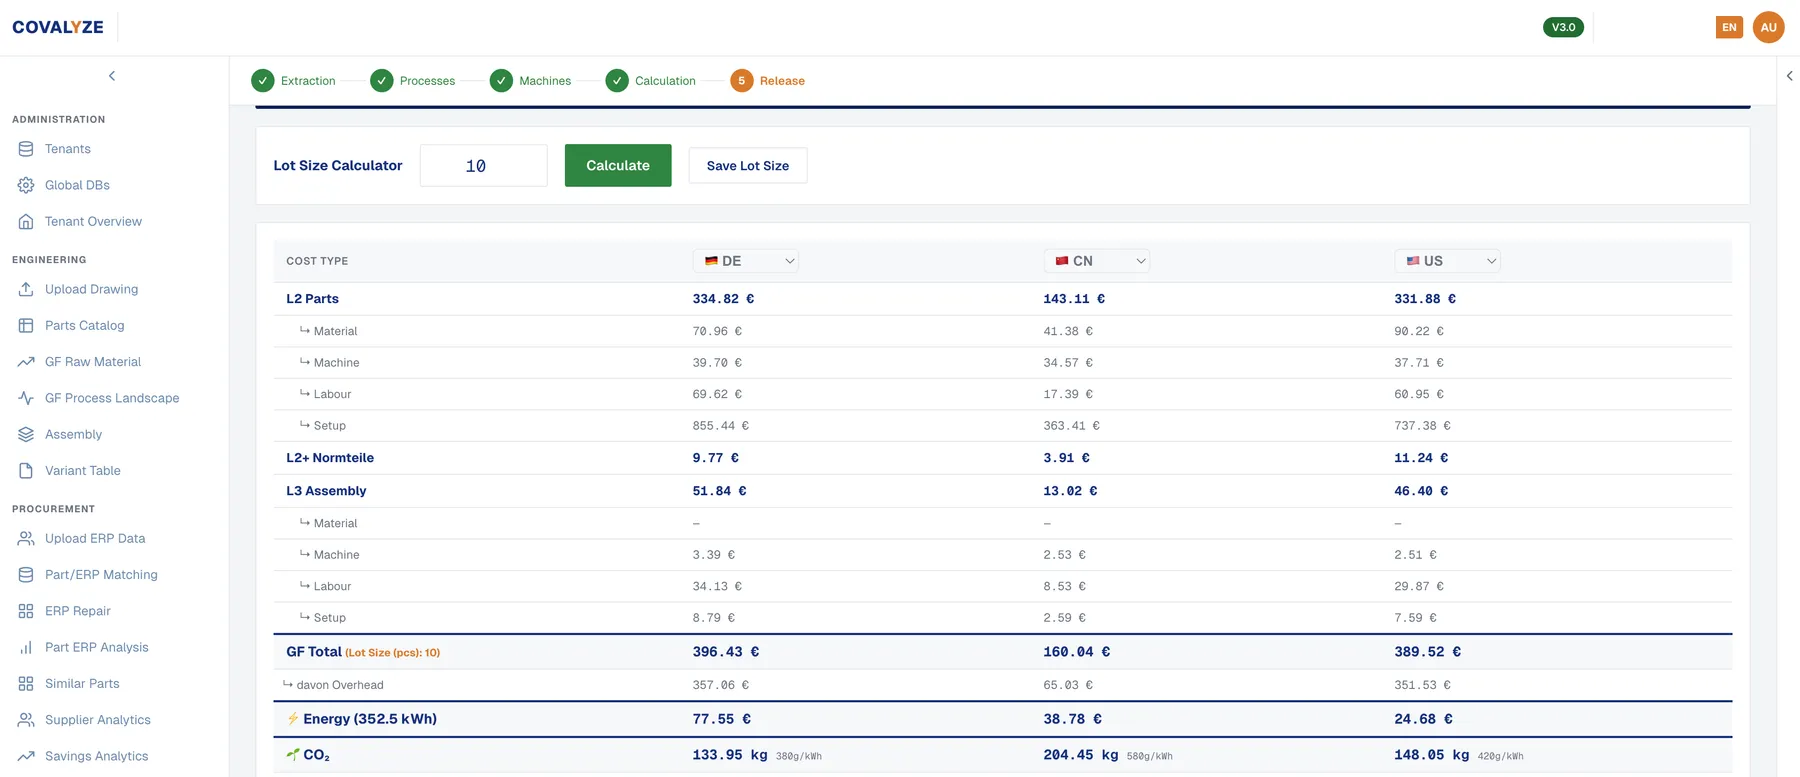
Lot size 10 Product view
The same DARIN cost table recalculated for a lot size of 10
The same calculation at lot size 10: 396.43 € in Germany, 160.04 € in China, 389.52 € in the United States. The setup is now spread across the batch.

Screenshots from a demonstration tenant, shown to make the mechanism visible. What the effect is worth on your parts depends on their setup share and current batch pattern — which is exactly what the calculation quantifies.

When quantity is not your lever

Bundling is the strongest lever — right up until it isn't.

Which lever moves the price is a result of the analysis, not an assumption we bring with us. Two of our own cases point in opposite directions, and that is exactly why all five levers get quantified separately before anyone starts negotiating.

Energy sector · 50 turned parts

Quantity was the lever

  • Piece quantity explained 33% of the price effect — the single strongest driver in the category
  • 50 high-runner parts were spread across more than 10 suppliers
  • Fragmented volumes meant no single relationship was large enough to justify volume pricing
  • The negotiation argument was consolidation and bundling, backed by a quantified model

Microcontrollers · forklift carriages

Quantity was not the lever

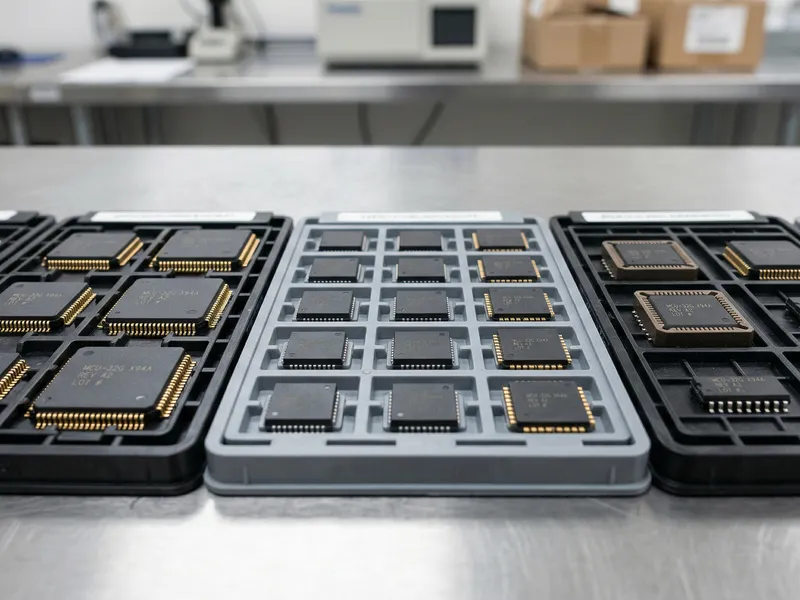
  • Microcontrollers: pin count explained ~45% and memory 28% of the price — quantity only 7%
  • Volumes did not materially explain the observed price differences at all
  • Forklift carriages: mast upright thickness, front plate type and front plate height explained most of the cost variance
  • Here the money sat in specification and design, not in order size

Same method, opposite conclusions. Effort spent on the wrong lever is the most expensive kind of savings project.

The negotiation package

What procurement actually walks in with.

Not a savings number to defend, but a per-part file: what the part should cost, where this supplier sits against that, why, and which questions to ask first.

Inside the negotiation package 10 deliverables
01 Target price per part, with the calculation behind it
02 Gap per supplier: paid price against should-cost
03 The cost drivers that explain each gap
04 Benchmark range where technically comparable parts exist
05 Quantity scenarios: order size, call-offs, bundling
06 Location scenarios for the same part
07 The technical counterarguments to expect, and the answers
08 A recommended negotiation corridor per part
09 Prioritized questions to put to the supplier
10 A baseline for tracking what is actually realised
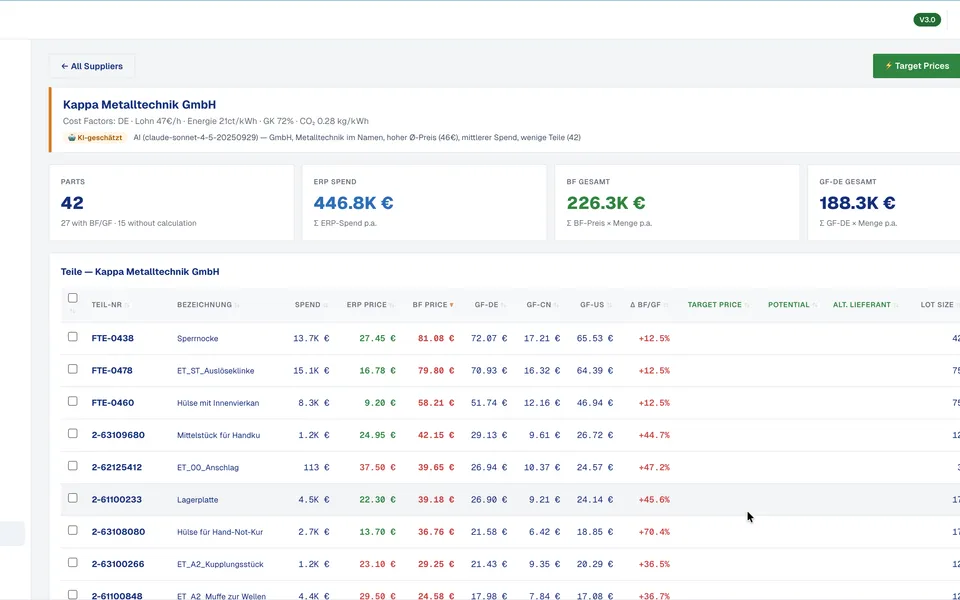
Negotiation brief, one supplier: 42 parts, paid price against should-cost
DARIN negotiation brief for one supplier: 42 parts with paid price, should-cost per country, target price, savings potential and lot size
Supplier evidence

Where the price goes — and how much of it is not cost.

For a supplier with should-cost coverage, the value chain is broken out: what sits in material, machine capital, energy, labour and overhead, and what sits above the should-cost. Alongside it, the regional drivers that explain why another location would be cheaper — machine capital, energy and labour, each separately.

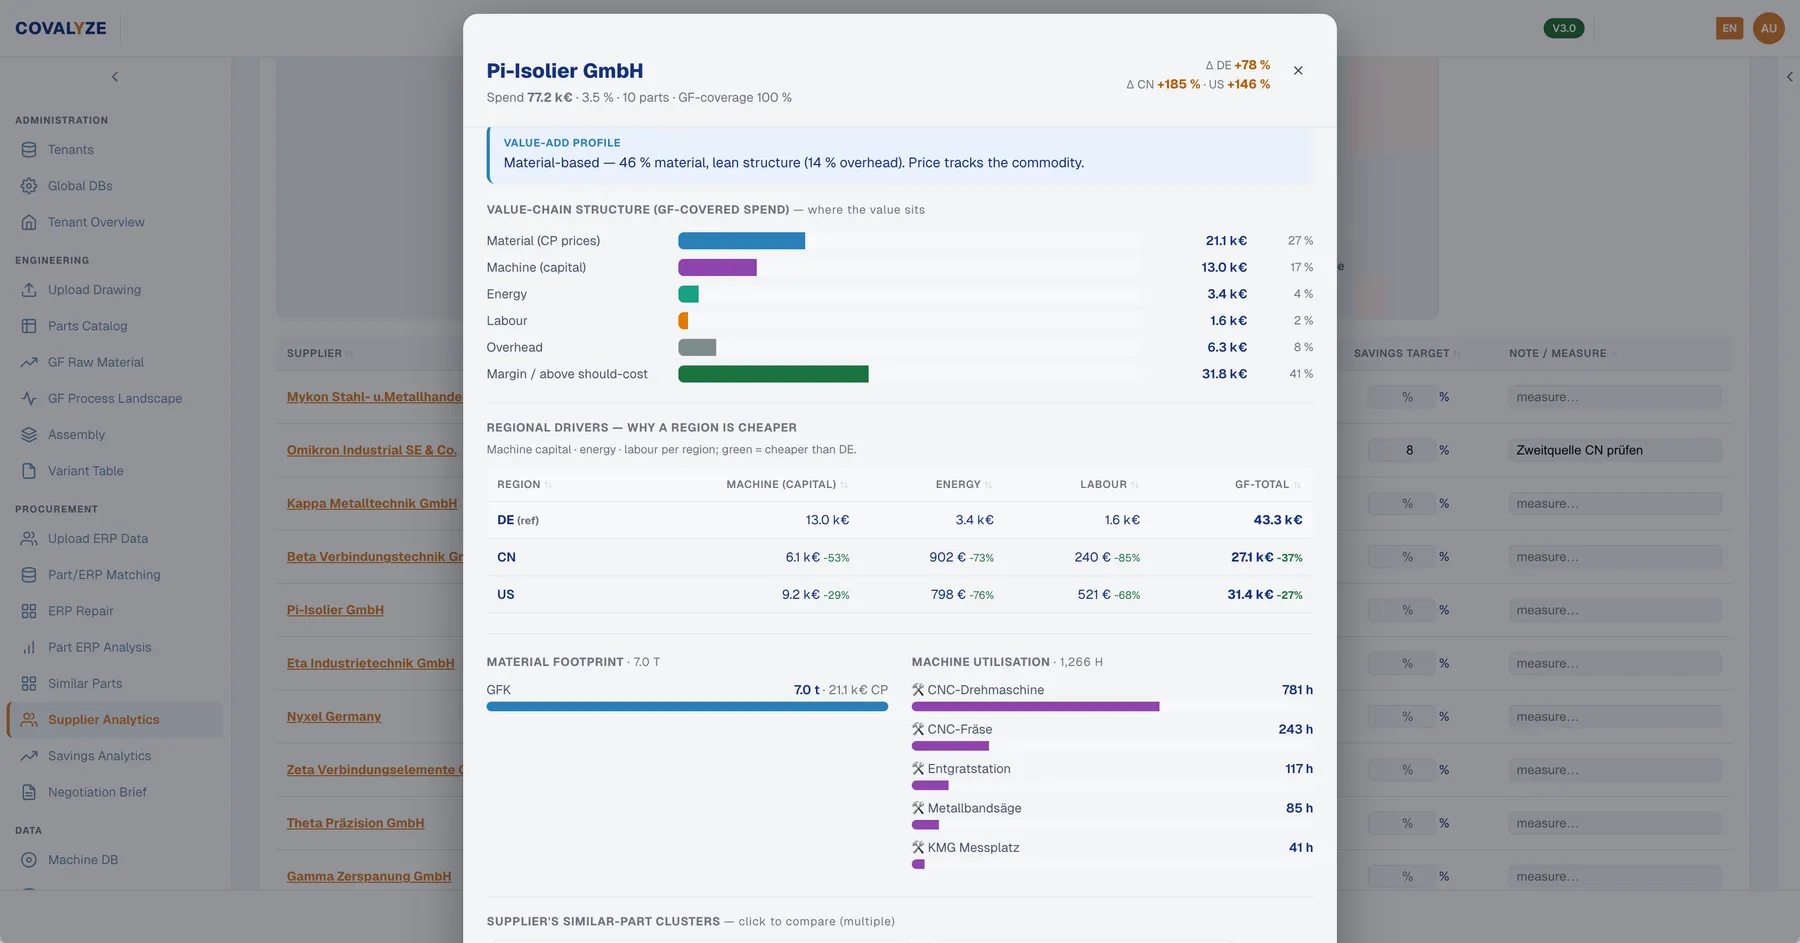
Supplier value-chain view Product view
DARIN supplier value-chain view splitting spend into material, machine, energy, labour, overhead and margin above should-cost, with a regional driver table
A material-based supplier with a lean overhead structure: material 27% of covered spend, machine capital 17%, and 41% sitting above the calculated should-cost. The table underneath shows what machine, energy and labour would cost in each region.

Supplier names in the screenshot are pseudonymised. A share above should-cost is not automatically illegitimate margin — it is where the conversation starts, not the conclusion.

Working with suppliers, not against them

A calculation is a better conversation than a discount request.

Nothing here assumes a supplier margin is illegitimate. Transparency cuts both ways — and a supplier who can follow your logic can also correct it.

  1. 01

    Fact-based discussions

    You ask about a specific cost element instead of asking for a percentage. Suppliers respond differently to “your setup time looks high for this batch size” than to “we need 5%”.

  2. 02

    Price-increase reviews that end

    When an increase is announced, the calculation shows which part of it is material, energy or labour — and which part is not explained. That turns an open dispute into a bounded one.

  3. 03

    Index and material clauses

    Once material is a separate line in the calculation, a material-price adjustment clause can be written and checked instead of argued about at every renewal.

  4. 04

    Joint value engineering

    The same breakdown that supports a negotiation also shows the supplier where a small design or process change would help both sides. Some of the best findings come back from them.

  5. 05

    Volume commitments that are priced

    If you know what a longer commitment is worth in setup and capacity terms, you can trade it deliberately rather than give it away.

  6. 06

    Supplier development over time

    Gaps that are structural rather than commercial — an unsuitable machine, a poor route — are development topics. They pay off across every part that supplier makes for you.

Average savings potential identified in COVALYZE Fast Track and platform engagements since 2019. Identified potential is not the same as realised savings — actual results vary by commodity, supplier base, quantity structure and data quality.

How to buy it

One part, one commodity group, or continuously.

A negotiation package for a single part is a one-day calculation. A whole commodity group with drawing extraction and a results walkthrough is the two-week Fast Track.

Start here

Part Check

One part · known process · one business day

On request

Send one drawing with its current price and quantities. You get the should-cost breakdown for that part, the levers that apply to it, and a target price you can put in front of a supplier.

  • One part, calculated end to end
  • Cost breakdown with every assumption visible
  • Applicable levers named and quantified
  • Walkthrough of the result with a specialist

Submit a part
Most chosen

Commodity Fast Track

One commodity group · up to 200 parts · two weeks

19.500 € Fixed fee

The fixed-scope way to buy the DARIN methodology. We extract your drawings, link them to spend data and deliver target prices, savings potential and negotiation evidence for a whole commodity group.

  • Up to 200 parts analyzed
  • Drawing extraction via PartIQ
  • Five-lever scenario matrix per part
  • Negotiation package and results walkthrough
See the Fast Track
Ongoing

Continuous capability

All commodities · platform access · ongoing

Custom

DARIN inside COVALYZE Analytics, used by your own team. Cost models stay live, new drawings flow in through PartIQ, and engineering, procurement and plants work from the same numbers.

  • Unlimited parts and categories
  • Target price calculator for new designs
  • Unlimited named users per category
  • Dedicated onboarding and support
Explore Analytics
The five levers

Negotiate is one of five.

A negotiation package is stronger when the technical levers have been priced too — because then you know which arguments the supplier can legitimately return.

Target prices and negotiations — frequently asked questions.

The number

A benchmark says what others pay. A target price says what this part should cost, built from its own manufacturing steps: material, cycle time, machine rate, labour, setup allocation and the overhead factor of the producing country. It survives the question “how did you get that number?”, which a benchmark generally does not.

Data and quantities

Per part: the drawing or specification, the current price, the supplier and production country, the annual quantity and — importantly — the order quantity or call-off pattern. Incoterms, framework terms and historical prices make the quantity and location scenarios sharper.

CTA background

Bring a calculation to the next price discussion.

Send one part or one commodity group with prices and quantities. You get target prices, the gap per supplier, the driver evidence and a negotiation corridor — plus a clear line between what is identified and what is realised.

Prepare a negotiation