COVALYZE ANALYTICS · TARGET PRICE CALCULATOR

Establish a defensible target price.

What a part is allowed to cost, built from the way it is made. Send a CAD file and four inputs, and get it costed by every process, country and order quantity that could apply.

How this connects

The Target Price Calculator is where COVALYZE Analytics turns a CAD file and a paid price into a target price. Behind it sits the DARIN should-cost method: material, machine, labour, setup, overhead.

The should-cost method
The calculator

Find the cheaper way to make the part.

One real STEP file, put through COVALYZE twice: once as a part milled out of solid stock, once as an investment casting. Rotate it, change the process, the country and the order quantity, and the cost structure changes underneath.

Milled Part.stp 251 × 120 × 105 mm
The example part rendered from Milled Part.stp: a forked steel bracket with two bores, 251 × 120 × 105 mm
22.1% of what is bought ends up in the part
Four inputs Everything else is calculated
Material Assumed
Steel
Geometry Read from the STEP file
251 × 120 × 105 mm
Surfaces Read from the STEP file
1,355.9 cm²
BOM structure Read from the STEP file
Single part
The scenario Change any of the three
Manufacturing process
Production country
Order quantity 1 pieces
CNC milling · Germany Manufacturing cost per piece
741.71 € per piece

Investment casting at this quantity: 13,175.25 €. 18x more.

  • Material 48.85 €
  • Machine 266.38 €
  • Labour 131.37 €
  • Setup 75.21 €
  • Overhead 179.63 €
  • Energy 40.27 €

However long the run gets, this part does not fall below 637.93 € a piece.

Stock per piece 29.69 kg 6.56 kg of it is the part
Time per piece 9 h 1 h 4 min of it is setup, bought once
Energy per piece 304.8 kWh 115.8 kg CO₂ on the local grid
Process chain Derived from the four inputs · 5 operations

Every piece starts as a solid block and the shape is cut out of it. Nothing is bought once: the machine repeats the whole removal for piece two, piece two hundred and piece two thousand.

  1. 01 Sawing / cut-off Band saw 6 min 1.1 run · 5 setup
  2. 02 Roughing CNC mill 3 h 25 min 137.5 run · 47 setup
  3. 03 Finishing CNC mill 4 h 58 min 271.2 run · 0 setup
  4. 04 Deburring Deburring station 19 min 16.7 run · 2 setup
  5. 05 Quality inspection CMM station 12 min 1.0 run · 10 setup
Crossover On this part, casting undercuts milling from piece 22 onward in Germany. Your part has its own number. Send us your own file

Figures are the unedited output of a COVALYZE example tenant for this one STEP file, calculated on 31 August 2026. Material prices are recalculated monthly and machine, labour and energy rates differ by plant, so the rates behind these totals are not published here and the totals move when yours are used. The part title is anonymised; geometry and cost figures are not.

Make-or-buy, as a number

Every process has a quantity at which it wins.

Milling buys nothing up front and therefore hardly gets cheaper with volume. Casting starts at the price of a mould and then falls away as the mould is divided across the run. The point where the two curves cross is the quantity from which the other process is cheaper, and it can be calculated rather than debated.

Manufacturing cost per piece, by order quantity Germany · both axes logarithmic
CNC milling 741.71 € at one piece, 638.04 € at 1,000 Investment casting 13,175.25 € at one piece, 40.40 € at 1,000
Germany 22 pieces 638.04 € against 40.40 € at 1,000
China 20 pieces 355.51 € against 20.58 € at 1,000
United States 22 pieces 594.59 € against 41.37 € at 1,000
What this replaces A process decision made on experience, with no quantity attached to it. Find the crossover on your part

At 1,000 pieces the same part is 94% cheaper cast than milled in Germany, a difference of 597.64 € on every piece. Figures are the unedited output of a COVALYZE example tenant for this one STEP file, calculated on 31 August 2026. Material prices are recalculated monthly and machine, labour and energy rates differ by plant, so the rates behind these totals are not published here and the totals move when yours are used. The part title is anonymised; geometry and cost figures are not.

What a calculation needs

Four inputs. Everything else is derived.

Three of the four are already in the CAD file. From those, COVALYZE derives the rest: which operations the part needs, how long each one takes, what is bought once per production run, and what changes when the quantity or the country does.

What we need from you

  1. 01

    Material

    No material note was found on a 2D drawing, so steel stood in as the default. The application says so rather than hiding it, and one correction from your engineer moves every figure below.

  2. 02

    Geometry

    Read from the solid model: 835.1 cm³ of material in the finished part, 6.56 kg net. Volume and envelope are what decide how much has to be removed, or how much has to be poured.

  3. 03

    Surfaces

    Total surface area, which sets the finishing pass, the deburring time and the surface treatment. On a milled part the finishing pass is the single largest block of machine time.

  4. 04

    BOM structure

    One component, no assembly. Where a BOM has levels, the assembly method comes in here and each level is calculated and rolled up in turn.

What COVALYZE derives from it

  • Process chain

    Which operations the part needs, in order, on which machine.

  • Process times

    Machining and handling time per operation, from the geometry.

  • Setup times

    What is bought once per run and then divided across the batch.

  • Quantity scenarios

    The same part costed at every lot size, so the quantity effect is visible.

  • Region scenarios

    The same part costed in each production country.

  • Energy and CO₂

    Consumption per piece, and the emissions that follow from the country mix.

Why it matters The work of costing a part stops being data entry. Send a file and see

A calculation on your parts replaces every assumption on this page with your materials, your machines, your labour rates and your quantity structure.

Target price · should-cost · benchmark

Three different numbers arrive under the same word.

Most disagreements about a target price are really disagreements about which of these three someone means. They answer different questions, they need different data, and only one of them is a position you can take into a supplier meeting.

Same word, different question Three numbers
01

Benchmark price

What do others pay for something like this?

Built from
Comparable prices, either inside your own spend or from the market.
Strength
Fast, and immediately credible in a commercial conversation.
Limit
Needs comparable parts. Says nothing about whether the comparison price was any good in the first place: a whole category can be overpriced together.
02

Should-cost

What does this part cost to make?

Built from
The manufacturing steps the part requires: material, cycle time, machine rate, labour, setup allocation, country overhead.
Strength
Works with no comparable part at all, and holds up line by line when a supplier pushes back.
Limit
It is the manufacturing cost, which is not yet a price. Nobody supplies at cost.
03

Target price

What is this part allowed to cost us?

Built from
Should-cost plus a margin the supplier is entitled to, checked against what comparable parts actually cost.
Strength
The number you can put in front of a supplier, with the reasoning behind every element of it.
Limit
A target price is a position, not a guarantee. Whether it is reached is decided in the negotiation.
Why it matters A target price is the only one of the three you can defend line by line. Get a target price for your part

Used together they check each other. A benchmark far below your should-cost means the calculation needs review. A benchmark far above it means the whole category has been priced without anyone asking why.

The same part, in COVALYZE

One file, two cost structures, side by side.

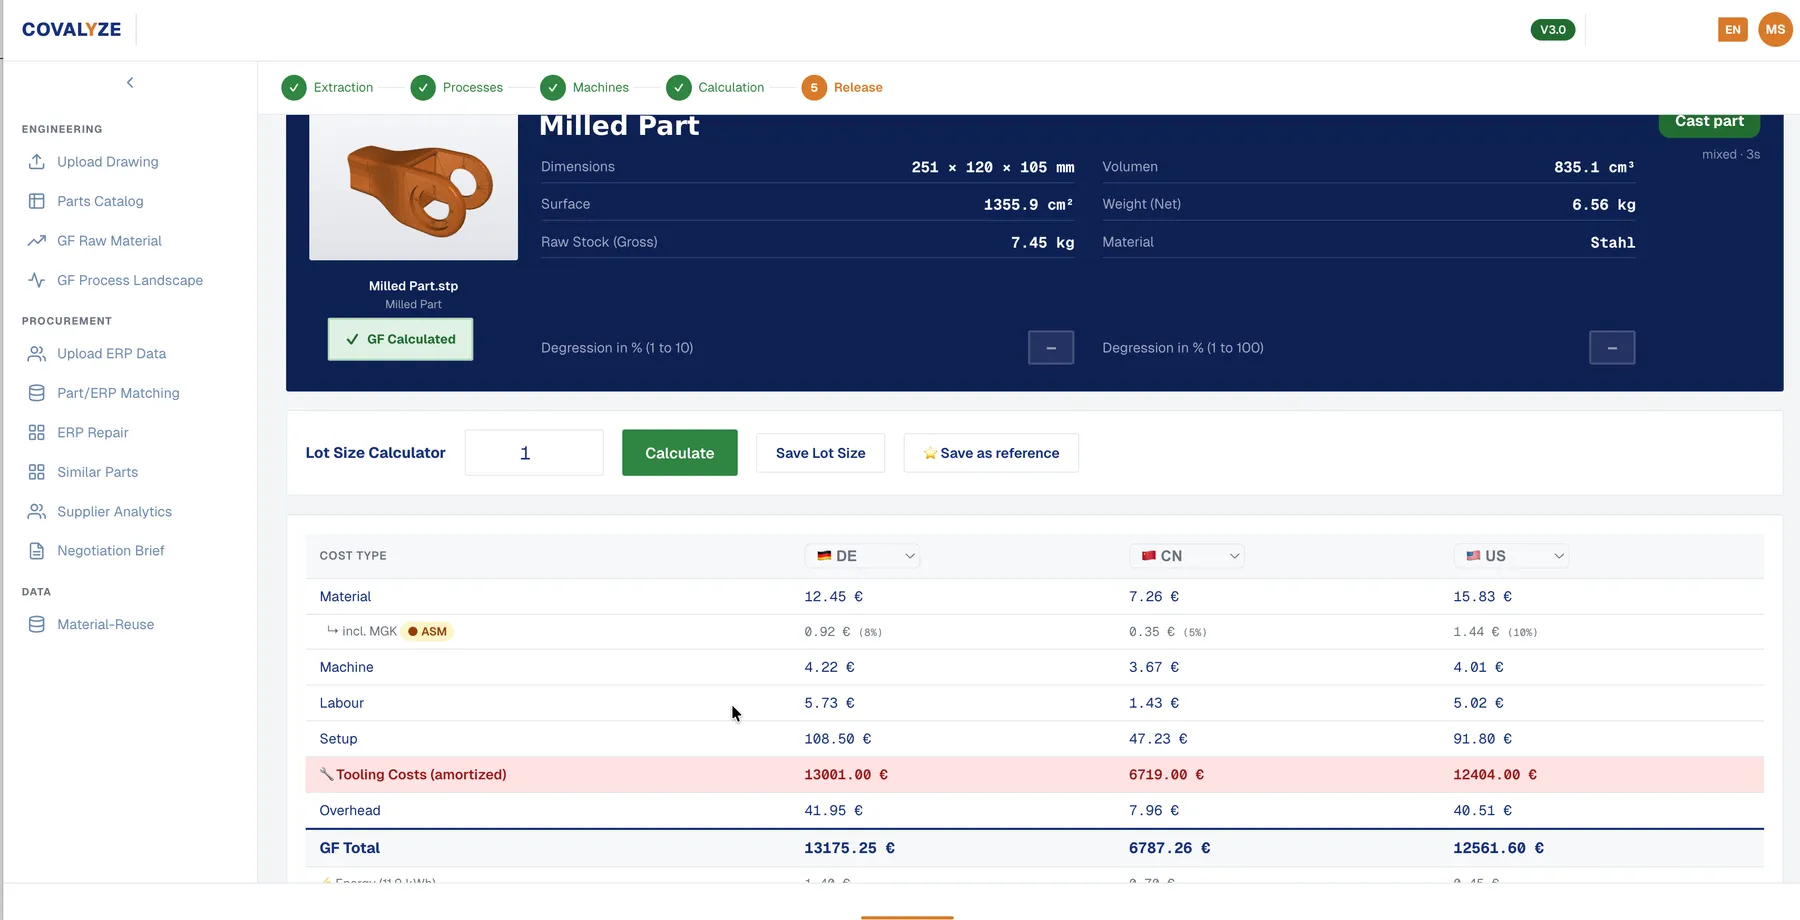
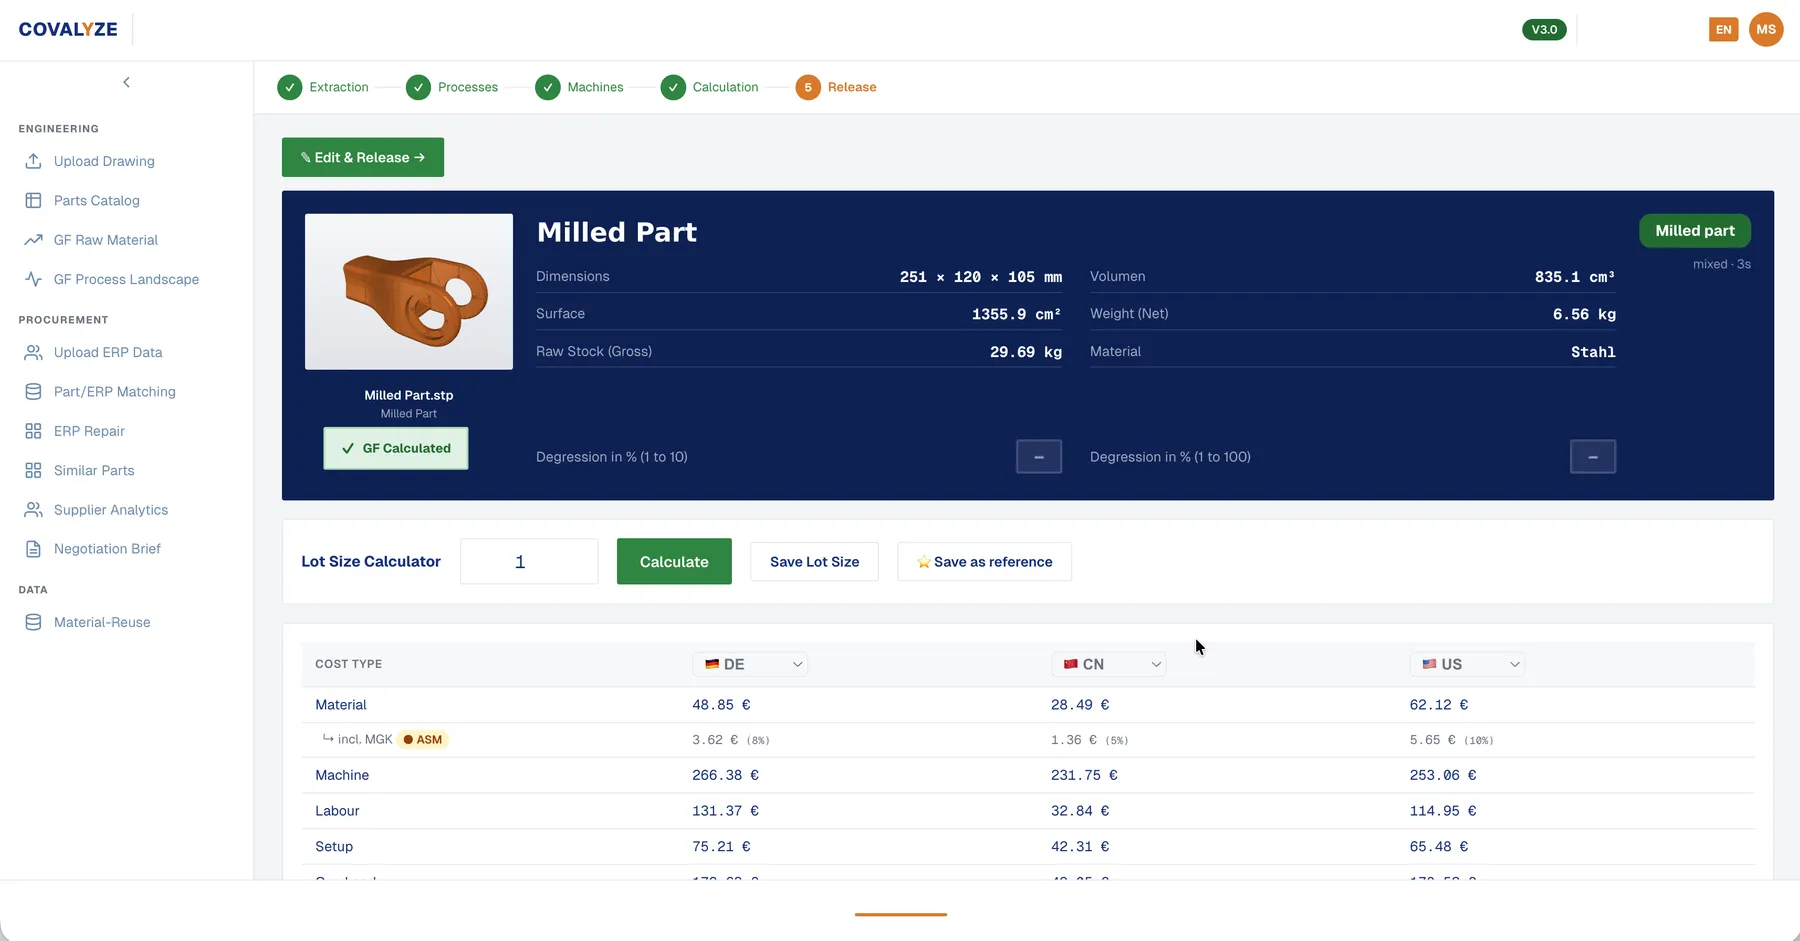
These are the two results the example STEP file produced in the application, in one session. One field changes between them: the confirmed manufacturing process. Everything downstream follows from it, including the raw stock (29.69 kg of solid against 7.45 kg of near-net blank), the whole process chain, and a tooling line that only one of them carries.

Confirmed process: milling Milled part
The example part costed as a CNC milled part: 29.69 kg raw stock against 6.56 kg net, with material, machine, labour and setup priced for Germany, China and the United States
Raw stock 29.69 kg for a 6.56 kg part. No tooling line, and a total of 741.71 € at one piece.
Confirmed process: investment casting Cast part
The same part costed as an investment casting: 7.45 kg raw stock and a tooling row of 13,001 € highlighted in red, priced for Germany, China and the United States
The same geometry at 7.45 kg of stock, and a mould of 13,001 € carried by the first piece alone.
On your part Send one file and get it back costed by every process it could plausibly be made with, alongside the one it is made with today. Get your part costed both ways

Screenshots from a COVALYZE example tenant. The part title is anonymised; the geometry, masses and cost figures are the unedited output.

Two routes

Whether you already have comparable parts decides how you get there.

Both routes end at a target price that holds up. Which one fits depends on your data, and most categories end up using both, because each one checks the other.

From your own data

Target Price Calculator in COVALYZE Analytics

  • Needs: Roughly 30 or more comparable parts with technical features and paid prices.
  • A price per feature: what one bend, one cutout or one m² of surface is worth in this category
  • A predicted price per supplier for a configuration you type in
  • The spend effect of changing a specification across the whole portfolio
  • A model-quality figure, so you know how much weight the prediction carries

From first principles

Should-cost calculation with DARIN

  • Needs: One drawing, the current price, the quantities and the production country.
  • A cost breakdown per element, with the formula that produced each one
  • A target price for a part with no comparable price anywhere
  • The same part priced in another country, another material or another lot size
  • Every assumption named, so a supplier can challenge a specific one

A prediction from your own data and a calculation from first principles are the strongest evidence you can hold at once. When the two agree, the number is hard to argue with.

In COVALYZE Analytics

A predicted price, per supplier, for a part that does not exist yet.

Where a category already holds enough comparable parts, the second route opens. A model fitted across that category returns what each technical feature is worth, and predicts what each of your suppliers would charge for a specification you type in. This is the difference between asking a supplier for a price and knowing roughly what the answer should be before you ask.

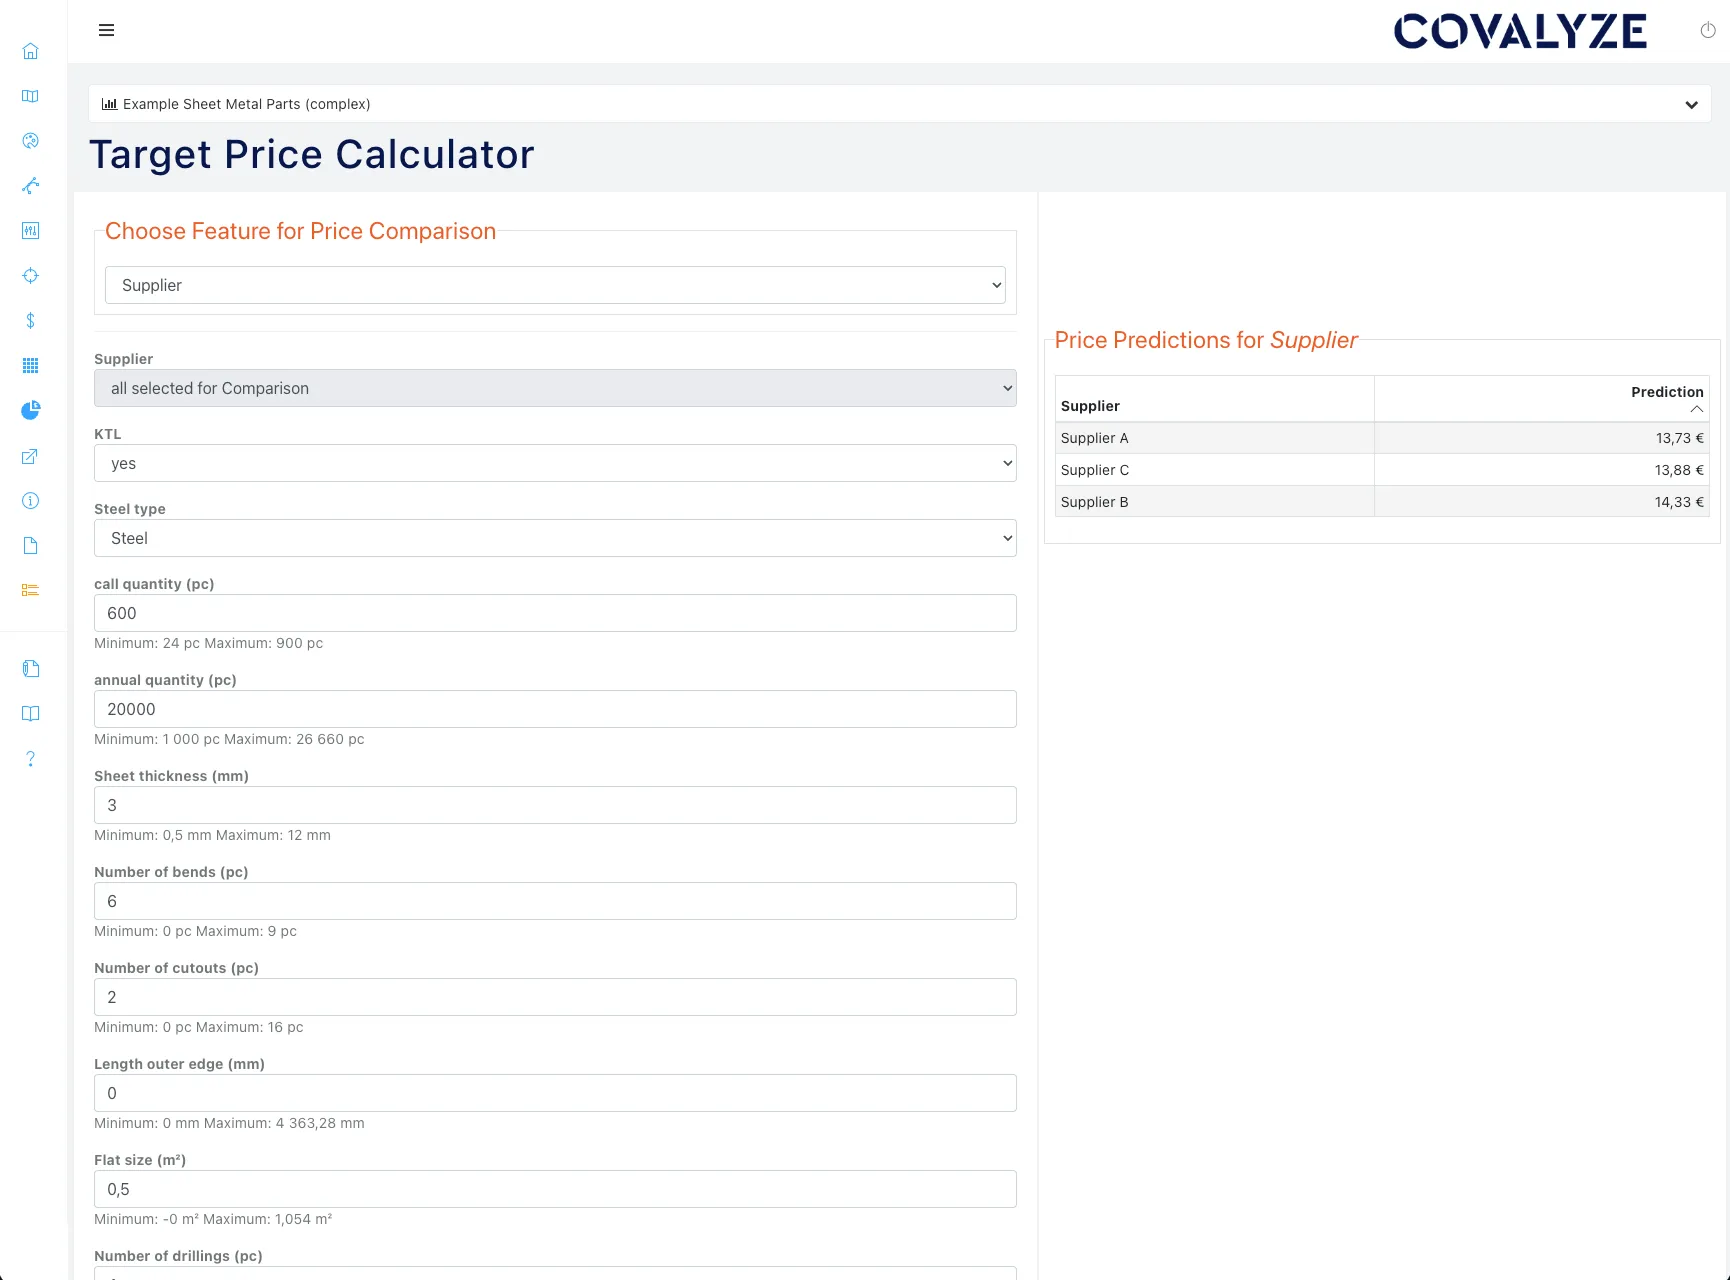
Target Price Calculator Example category
COVALYZE Analytics Target Price Calculator: a specification form on the left and predicted prices for three suppliers on the right
The same configuration priced against three suppliers at once. Where they diverge is where the negotiation has something to work with.
What it needs Roughly 30 comparable parts with their technical features and the prices you paid for them. See it on your own category

Screenshot from a demonstration tenant with pseudonymised supplier names. Feature prices are specific to a category and to the data behind it. They are not industry averages and they do not transfer between customers, which is why the platform reports the quality of the fitted model alongside every prediction.

From a target price to a negotiation

Know where to challenge a supplier, and with what.

A target price on its own is a claim. What makes it work in the room is the line underneath it: which cost element explains the gap, what the alternative would be, and which question to ask first.

What a category manager walks in with 8 deliverables
01 Target price per part, with the calculation behind it
02 The gap between that and what you pay today, per supplier
03 Which cost element explains the gap: material, process, location or quantity
04 The same part priced in another country, another material, another process
05 Quantity scenarios: order size, call-off pattern, cross-plant bundling
06 The quantity at which a different manufacturing process becomes the cheaper one
07 The technical counterarguments to expect, and the answers to them
08 Every assumption named, so a supplier can challenge a specific one
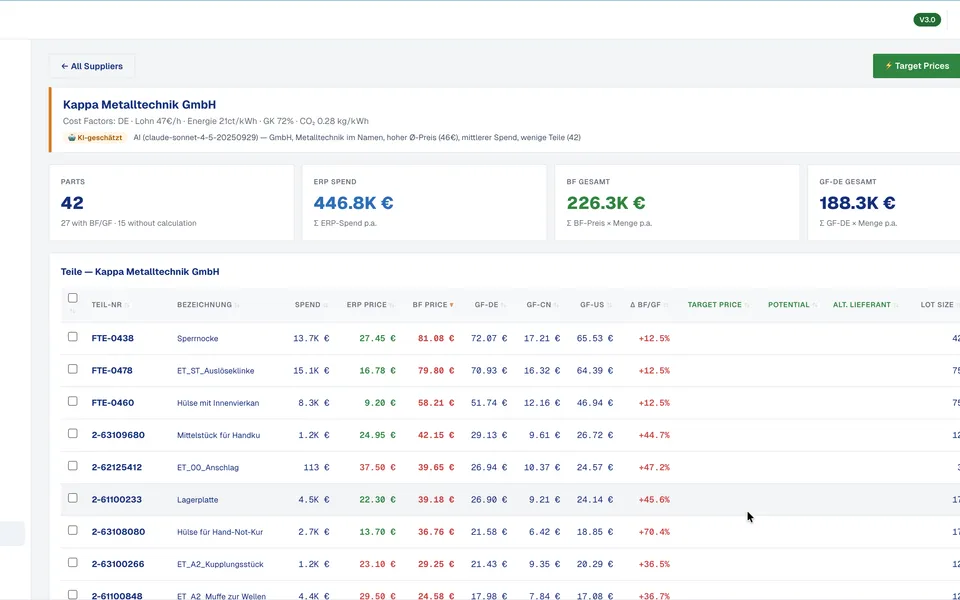
One supplier, 42 parts: paid price against target price
Negotiation brief for one supplier listing 42 parts with paid price, should-cost per country, target price, savings potential and lot size
After the target price

A gap is only useful once you know which lever closes it.

The calculation names the element that explains the difference. Each of the five levers acts on a different one, and each has its own page.

The DARIN methodology
Client results

Where a calculated cost changed the conversation.

The same method as the example above, run on real portfolios: should-cost straight off 3D geometry, order quantity as the cost driver nobody had quantified, and target costs derived from the part rather than negotiated down from last year's price.

Target price calculation: frequently asked questions.

The number

A target price is what a part is allowed to cost you: the cost of manufacturing it (material, machine time, labour time, setup allocation and the overhead of the production country) plus a margin the supplier is entitled to. It is built from the part rather than from last year's price minus a percentage, which is why it survives the question every buyer eventually gets asked: how did you arrive at that number?

The example on this page

One STEP file, 251 × 120 × 105 mm and 6.56 kg of steel, costed by COVALYZE twice: once as a part milled out of solid stock, once as an investment casting. Same geometry, same material, same four inputs. At one piece the milled part is 741.71 € and the casting is 13,175 €, because the casting has to pay for a mould first. At 1,000 pieces the milled part is still 638.04 € and the casting has fallen to 40.40 €. The two swap places at piece 22.

Using it on your parts

A CAD file, a drawing or a specification, and the BOM context if the part sits in an assembly. The price you pay today, the annual quantity and the order quantity or call-off pattern turn the calculation into a negotiation position rather than an estimate. Everything else, including the process chain and every process time, is derived.

In COVALYZE Analytics

It fits a price model across a whole category: every part, its technical features, and the price actually paid. The model returns what each technical feature is worth in your category, and from those figures it predicts what a given supplier would charge for a configuration that does not exist yet. It needs roughly 30 or more comparable parts with features and prices. Where you do not have that, the bottom-up should-cost route on this page reaches a defensible number from the other direction.

CTA background

Send one file. Get a target price you can defend.

One documented part comes back within a business day: the process chain, the full cost breakdown per country, the quantity at which a different process takes over, the gap to what you pay today, and every assumption named so your supplier can challenge a specific one.

Send a CAD file