Opening Brief
At a Glance
The Situation
A customer under strong cost pressure needed a reliable negotiation basis for a highly diverse portfolio of low-volume technical supplier parts.
The portfolio included GFRP, plastic / PVC, and steel components with annual quantities ranging from single units to low double-digit volumes. Using COVALYZE, the project team analyzed 180 of 198 part numbers, covering approximately 91% of the spend, and identified around 20% savings potential through detailed part-level should-cost analysis.
Key Figures
A diverse supplier portfolio drawn from a broader base of more than 2,000 technical components.
Representing approximately 91% of the available spend.
Covered by the analyzed supplier portfolio.
Across the analyzed portfolio, validated at the level of each individual part.
Plus 35% plastic / PVC and a remaining share of steel.
Likely PLM default density of 1.0 vs. a realistic ~1.9 for the analyzed GFRP material.
Problem Frame
The Challenge
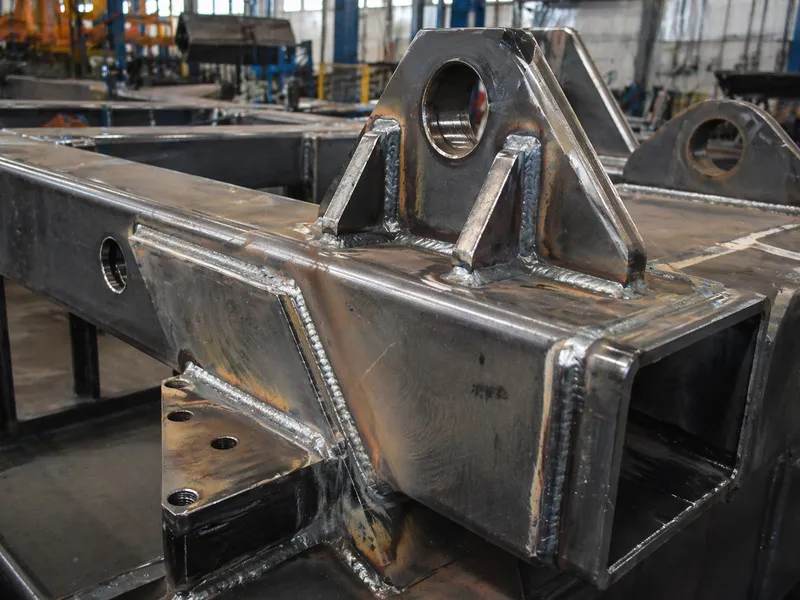
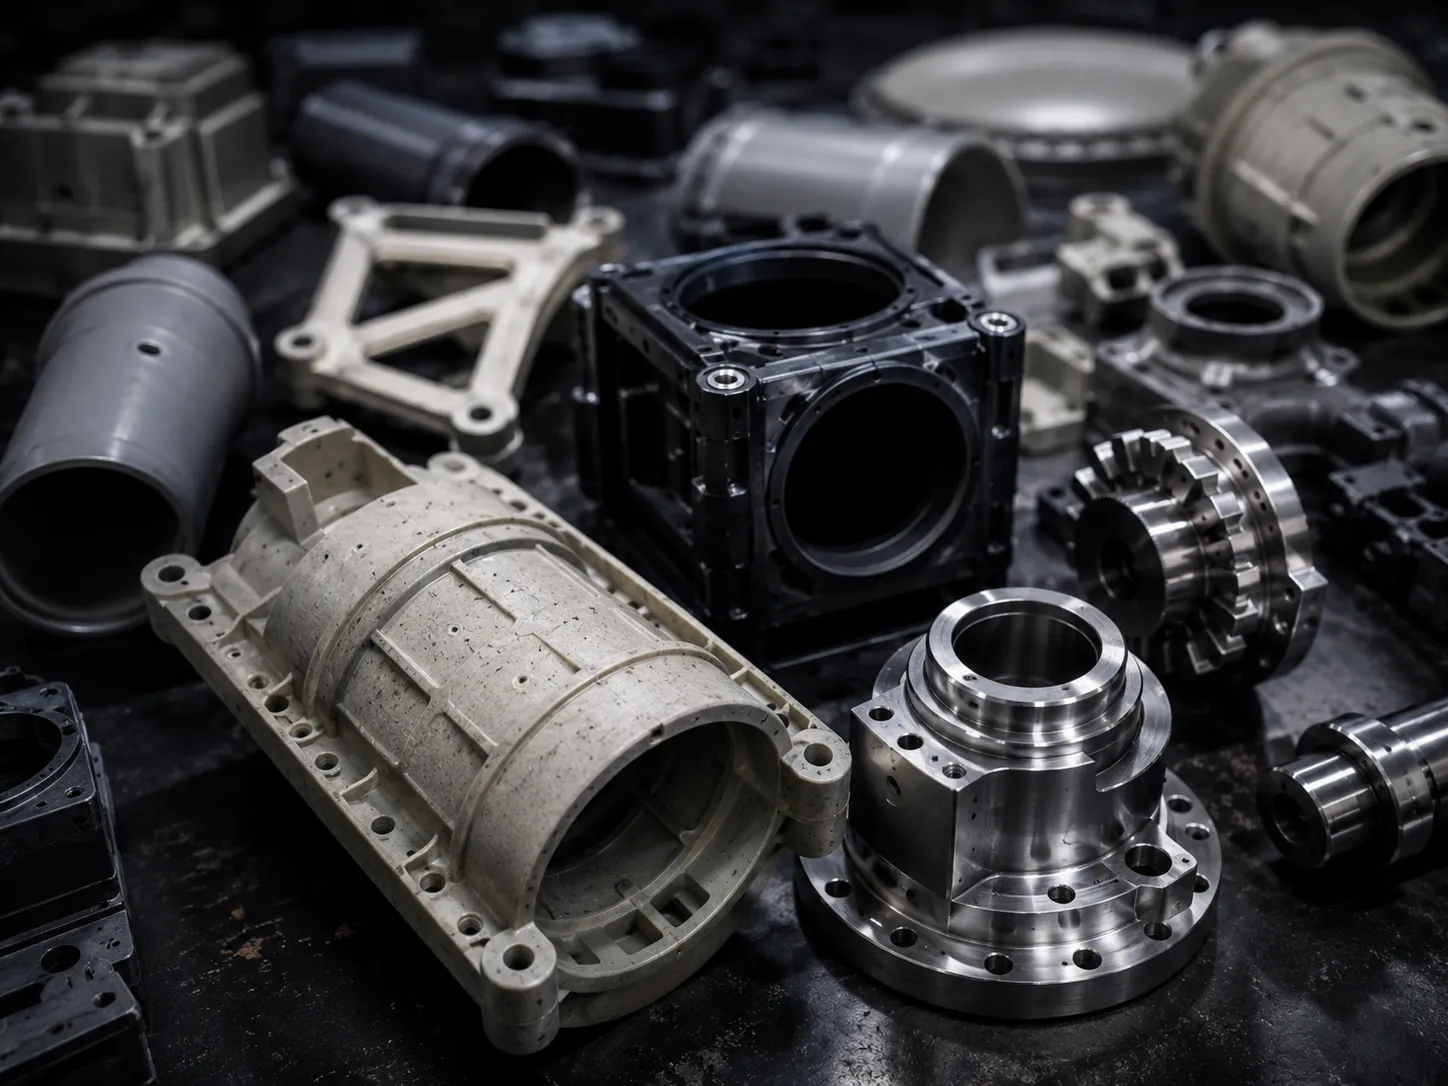
The analyzed supplier portfolio consisted of 198 part numbers with a total spend volume of more than €550,000, spanning different material categories and manufacturing processes. Some parts weighed up to approximately 30 kg, and the processing methods ranged from simple sawing operations to milling of GFRP, plastic, or steel blocks.

The Portfolio in Scope
- » A broader portfolio of more than 2,000 technical components, many in very low annual quantities
- » 198 part numbers in the analyzed supplier portfolio, with more than €550,000 in spend
- » Material split of ~45% GFRP, ~35% plastic / PVC, and a remaining share of steel
- » Annual quantities mostly between 1 and 25 units, with some parts up to approximately 30 kg
Why It Was Difficult
- » Traditional category-level cost reduction did not fit a portfolio this diverse
- » A generic supplier negotiation would not have been sufficient
- » Each part required its own fact-based negotiation story
- » The customer expected little to no savings and was cautious about challenging suppliers amid rising raw material prices
Execution Design
The Approach & Analysis
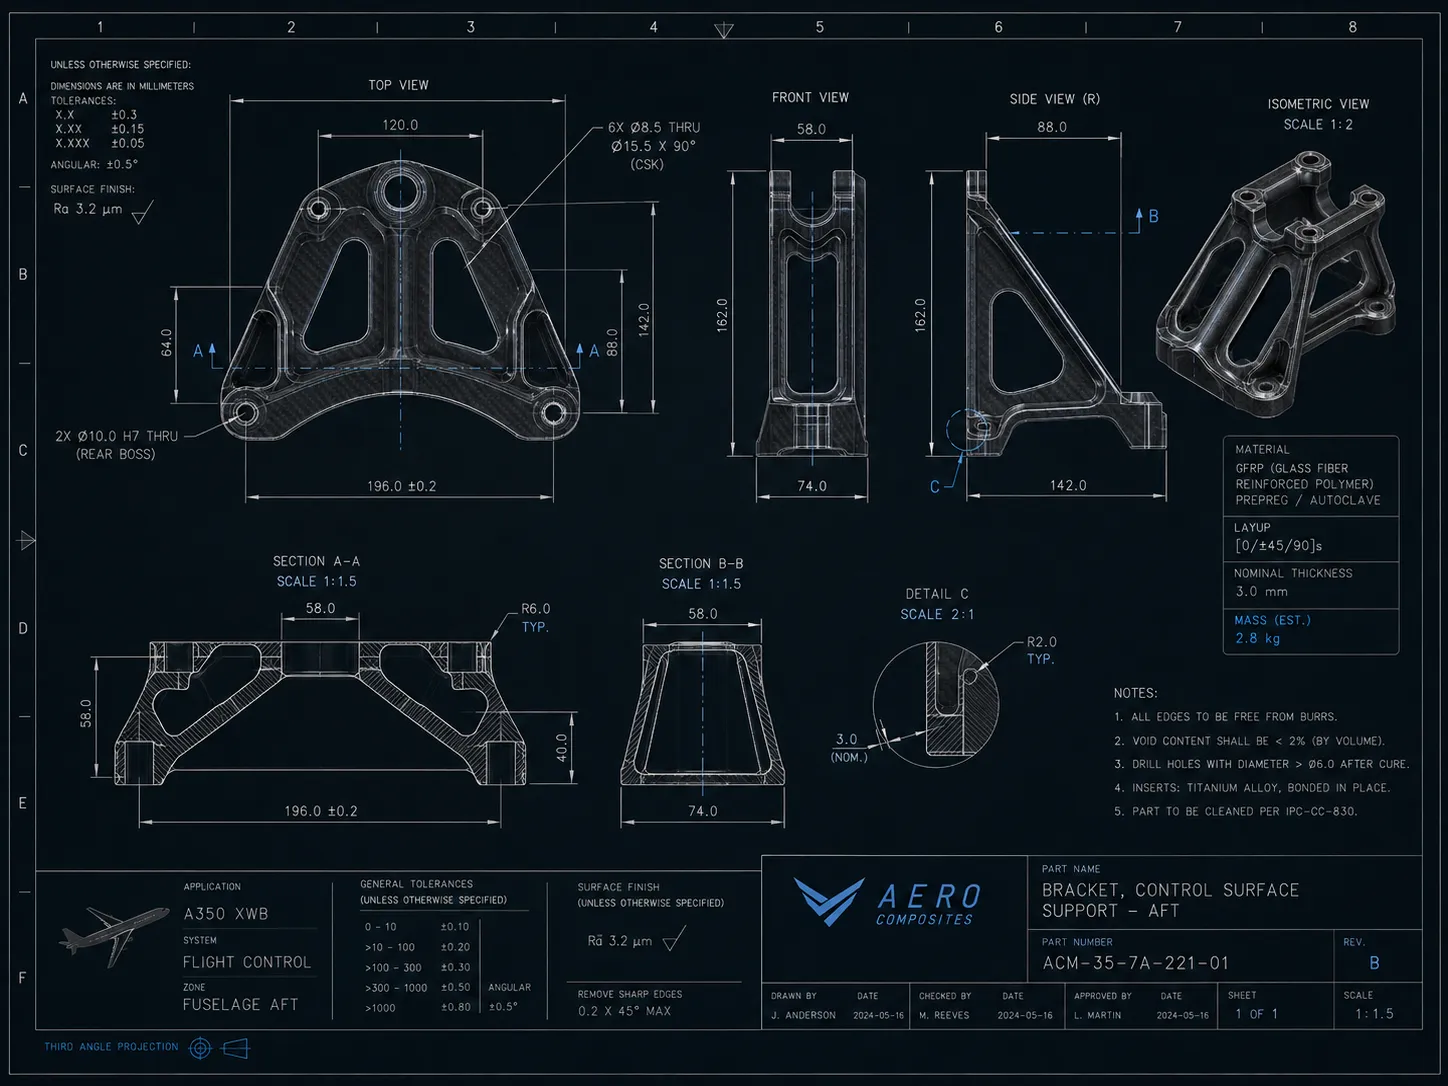
A data foundation built from 2D drawings and 3D geometry.
COVALYZE analyzed 180 part numbers, representing approximately 91% of the available spend, by combining technical drawing data with 3D geometry evaluation. A key task was the mapping between drawing data and ERP data: file names were structured around document numbers, while commercial data was based on ERP part numbers. COVALYZE supported the creation of a reliable link between technical documentation and commercial spend.
From 2D drawing data
- » Material specifications
- » Tolerances
- » Aerospace-related specifications and norms
- » Part numbers
- » Technical requirements
From 3D geometry
- » Volume from the 3D geometry
- » Surface area
- » Weight-related calculations
- » Geometric foundation for the should-cost model
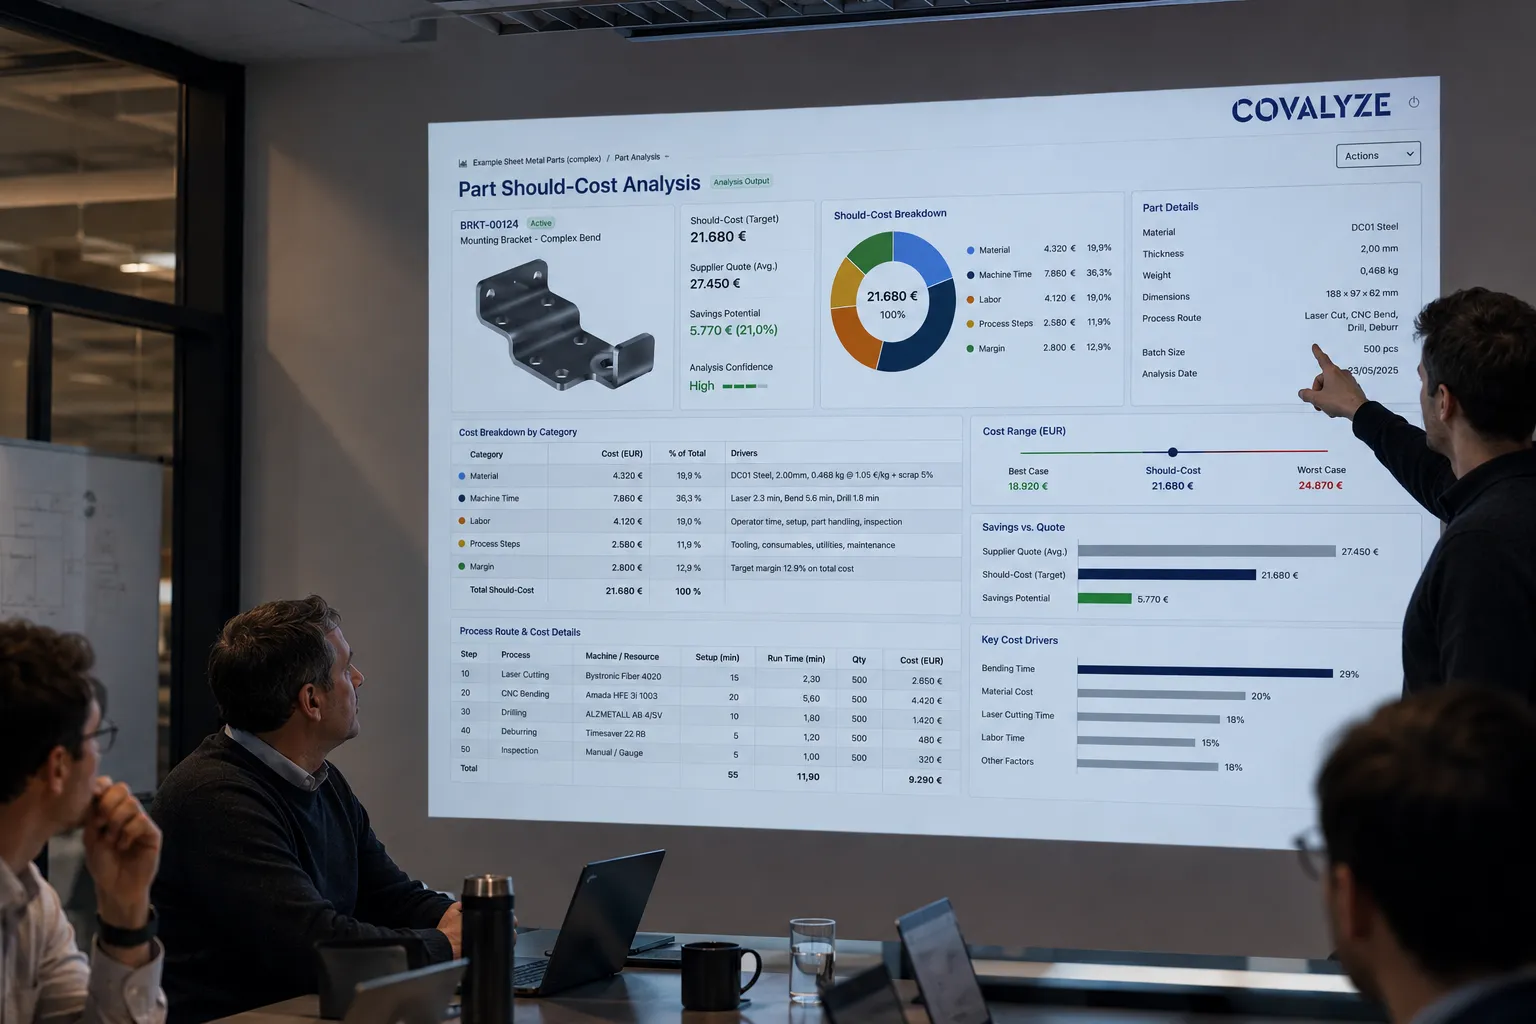
A detailed should-cost view for every part
For every analyzed part, COVALYZE created a should-cost calculation that let the customer understand where prices were justified, where they were aggressive, and where they exceeded the calculated target cost.
- » Material cost
- » Machine time
- » Labor cost
- » Manufacturing process assumptions
- » Additional processing steps
- » Greenfield and brownfield cost logic
- » Supplier-side margin indications
Differentiated Picture
The analysis did not show that the supplier was uniformly expensive. It revealed a differentiated picture — a far stronger basis for negotiation than a single average savings target.
- » Some parts were priced above should-cost
- » Some parts were priced competitively
- » Some parts appeared to be priced below calculated supplier cost
- » GFRP parts showed stronger savings potential than steel parts
- » Steel parts appeared more competitive, likely due to stronger supplier competition
Additional Finding: Likely PLM Data-Quality Issue
During the analysis, COVALYZE performed a sanity check between the 2D drawing information and the 3D geometry.
This revealed a likely systematic issue in the weight calculation for GFRP parts: the 2D drawings showed weight values roughly half of the values calculated from the 3D geometry.
After manual validation, the likely root cause was a default density of 1.0 for GFRP in the customer’s PLM or master-data logic, while the realistic density for the analyzed material was closer to 1.9.
Should-Cost Calculation
A transparent should-cost breakdown for 180 parts (~91% of spend) revealed approximately 20% savings potential across the analyzed portfolio.
~2x
3D vs. 2D weight gap
1.0
PLM default density
1.9
Realistic GFRP density
COVALYZE validated the 3D geometry and used the corrected, higher weight values for the should-cost calculation. This was important because it avoided overstating the savings potential: if the lower 2D weight values had been used, the calculated supplier gap would have appeared much larger.
Instead of exploiting the lower weight, the team used a conservative and technically validated calculation basis.
Correcting the GFRP weight logic delivered more than a defendable number. It produced:
- A conservative, technically validated calculation basis
- Savings potential that was not overstated
- A data-quality signal reaching beyond procurement
The result was a savings case the customer could review and defend, part by part.
Outcome & Impact
The Result
The analysis identified approximately 20% savings potential across the analyzed portfolio — and the detailed part-level breakdown made that result transparent and reviewable.
The customer initially challenged the result because the potential was higher than expected. But for each part, they could see the assumptions behind the number — material prices, setup times, machine times, labor shares, manufacturing steps, cost structure, and calculated target cost. This transparency moved the discussion from skepticism to action, giving the category team a concrete, part-specific negotiation basis instead of a general price-reduction request.
Business Impact
Supplier negotiation
A part-level negotiation basis for a complex low-volume portfolio enabled targeted discussions by component, instead of generic price pressure.
Cost transparency
The main lever was not extreme geometric complexity, but strongly varying €/kg price levels for technically comparable parts — now made visible.
Data quality
A likely GFRP weight-logic issue in the PLM / master-data environment surfaced, with relevance beyond procurement for logistics, transport, and warehousing.
Even in highly specialized low-volume categories, significant savings potential can be identified when technical cost logic is calculated at the level of each individual part.

“We analyzed 180 low-volume technical supplier parts, identified around 20% savings potential, and created a conservative, part-level should-cost basis for supplier negotiations — while uncovering a likely PLM weight-data issue in the GFRP components. The customer moved from broad assumptions to precise, part-specific discussions.”