Opening Brief
At a Glance

The Situation
The meeting began with a private equity investor who had already seen prior results for one portfolio company. During the session, 20 drawings he had provided were tested live with PartIQ, and a should-cost analysis was performed retrospectively.
The reaction was immediate. After seeing the output, the investor introduced another portfolio company and made clear that the opportunity there could be even larger: a plant engineering business in the German-speaking region outside Germany, with highly customized welded assemblies, strong engineering know-how, and a need for faster, more reliable quoting.
Using COVALYZE PartIQ and COVALYZE Analytics, the discussion quickly shifted from a technical proof point to a broader question: how much more useful could should-costing become if the same company moved from 2D drawings to 3D models?
Key Figures
Provided by the investor during the meeting and costed retrospectively with PartIQ.
Complete structured cost breakdown generated during the investor meeting, without pre-processing or preparation.
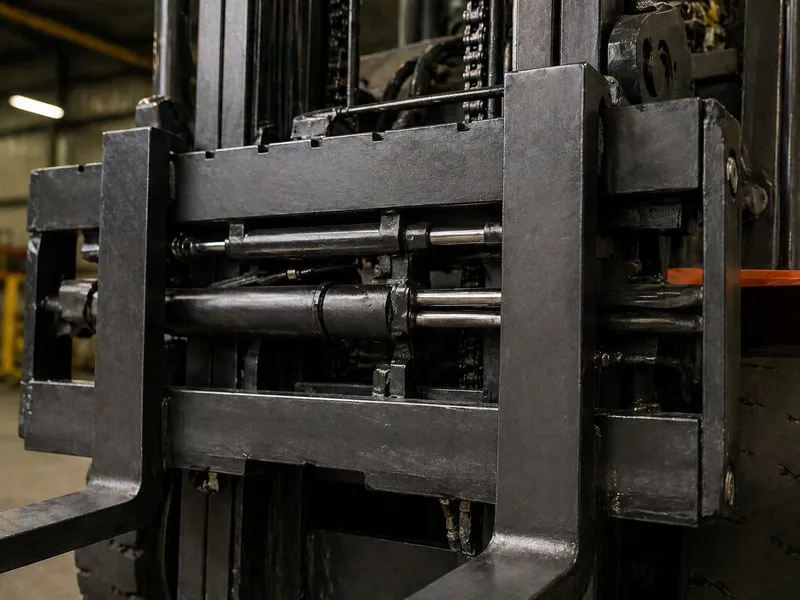
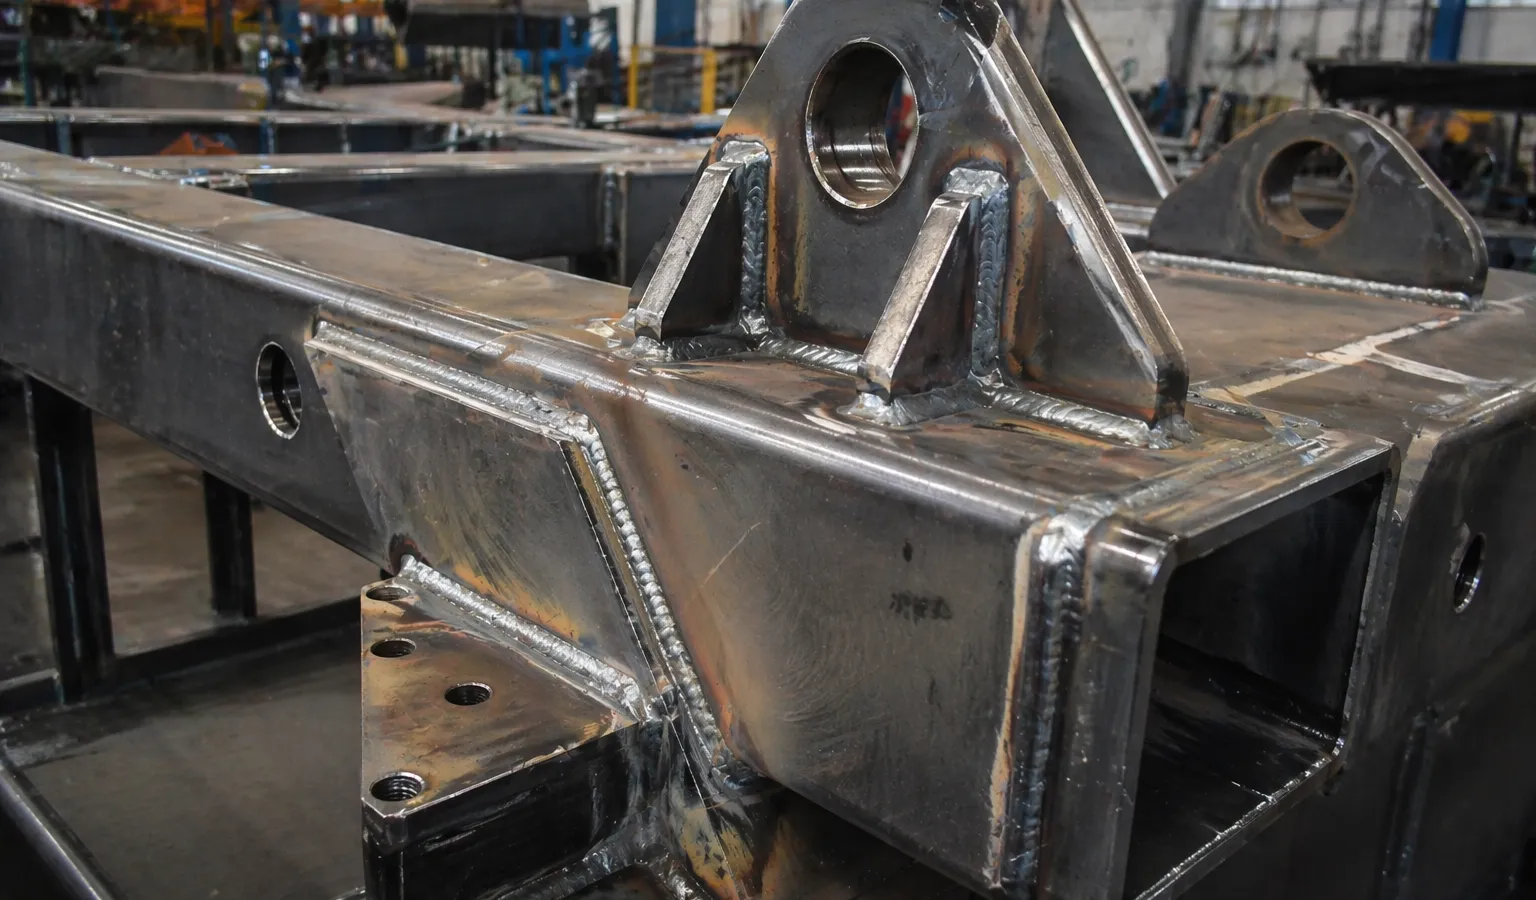
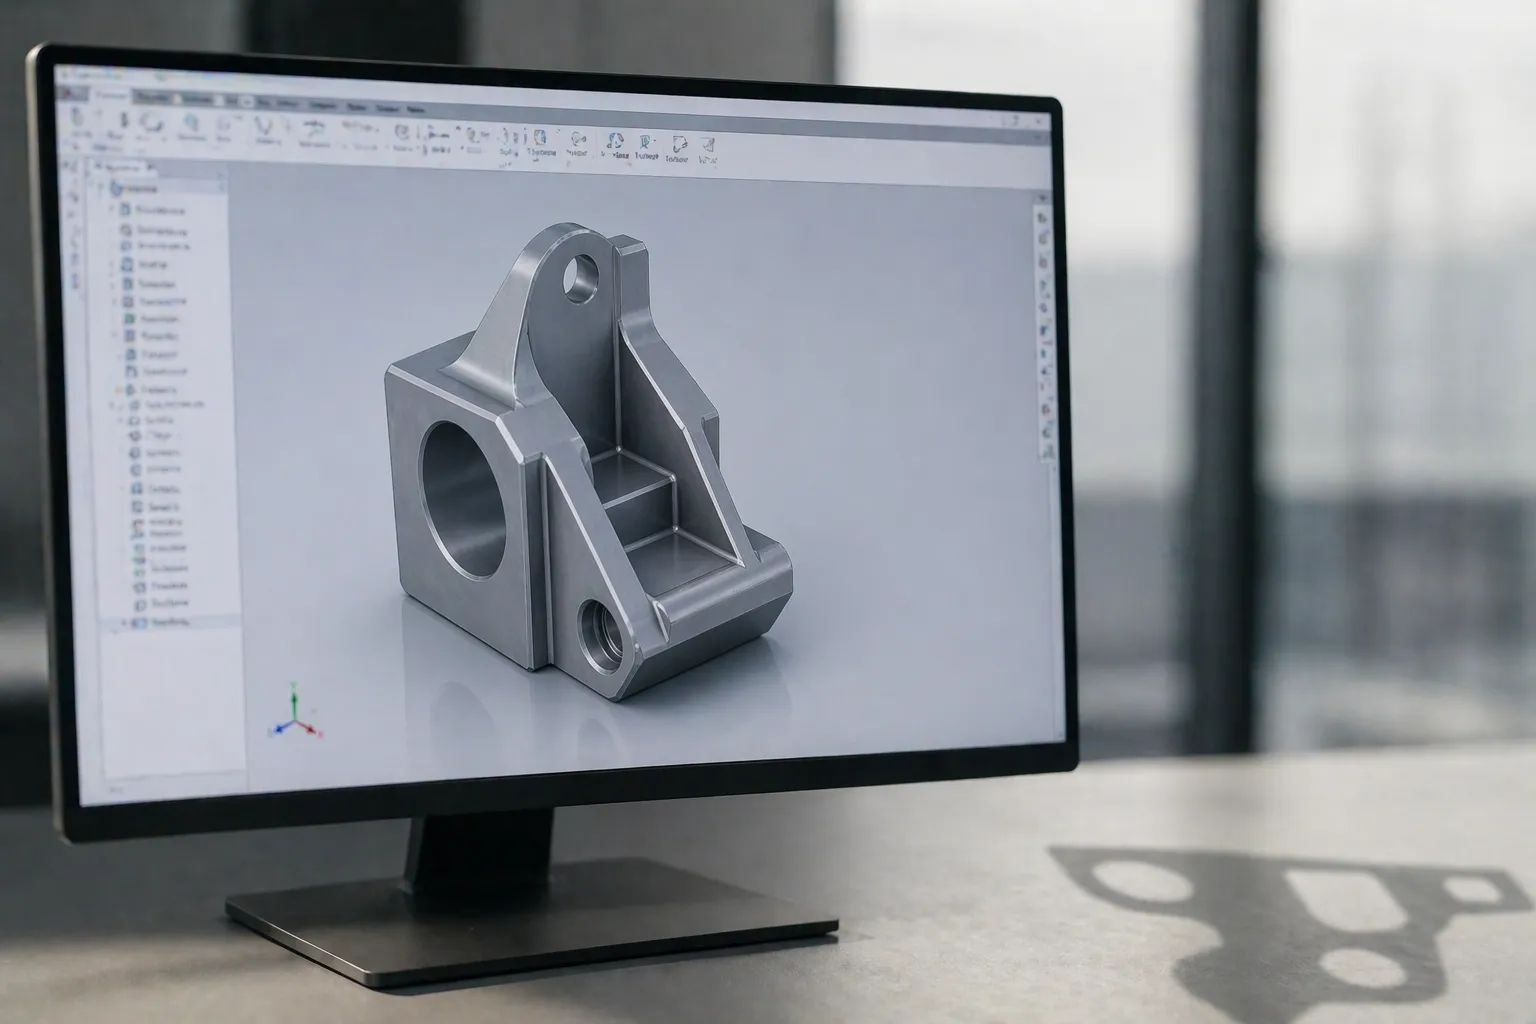
A commercially relevant welded construction with multiple manufacturing steps.
The live demo part was smaller than earlier projects, but still complex enough to prove the point.
Should-cost output produced within seconds during the investor discussion.
A typical 3D model yields far more structured costing data than a 2D drawing.
Problem Frame
The Starting Point
This was not a greenfield situation. A previous project had already analyzed highly complex 2D drawings for welded assemblies at the portfolio company and delivered a strong result. The key question was not whether costing from drawings was possible. It was how much more detailed, faster, and more operational the workflow could become with 3D.
What Had Already Been Proven with 2D
- » 100+ parts in the earlier 2D drawing project
- » Large welded assemblies for storage structures, crane-related systems, and other customer-specific constructions
- » Up to 1.5 tons for the largest assemblies in the historical dataset
- » Very low quantities per design, with even the largest design reaching only around five units
The company's strength was not steel fabrication itself. Its core capability sat in automation and control technology, while steel construction was outsourced so it could deliver complete customer solutions. That made reliable supplier-facing should-costing especially valuable.
Why the 2D Baseline Was Still Limiting
- » Drawing quality varied strongly between newer CAD-origin drawings and older, inconsistent legacy files
- » For welded assemblies, each individual component on the drawing had to be identified separately to derive material needs and total weight
- » Even in a strong workflow, 2D typically yields only 25-30 structured parameters for should-costing
- » The second portfolio company also faced a cultural hurdle: management was open to change, while the layer below remained skeptical of external input
Strong Baseline
Even with heterogeneous 2D source data, the earlier project achieved model quality of nearly 90 percent once the drawing output was linked with ERP data. That outcome established credibility with the investor. It also created the ideal setup for the next question: what happens when the input shifts from drawings to clean 3D geometry?
Execution Design
What Changed with 3D
The shift was not cosmetic. It was structural.
The investor's critical question was simple: what is the real difference between repeating the same exercise with 3D models instead of 2D drawings? The answer was equally clear. The usable data depth changes dramatically.
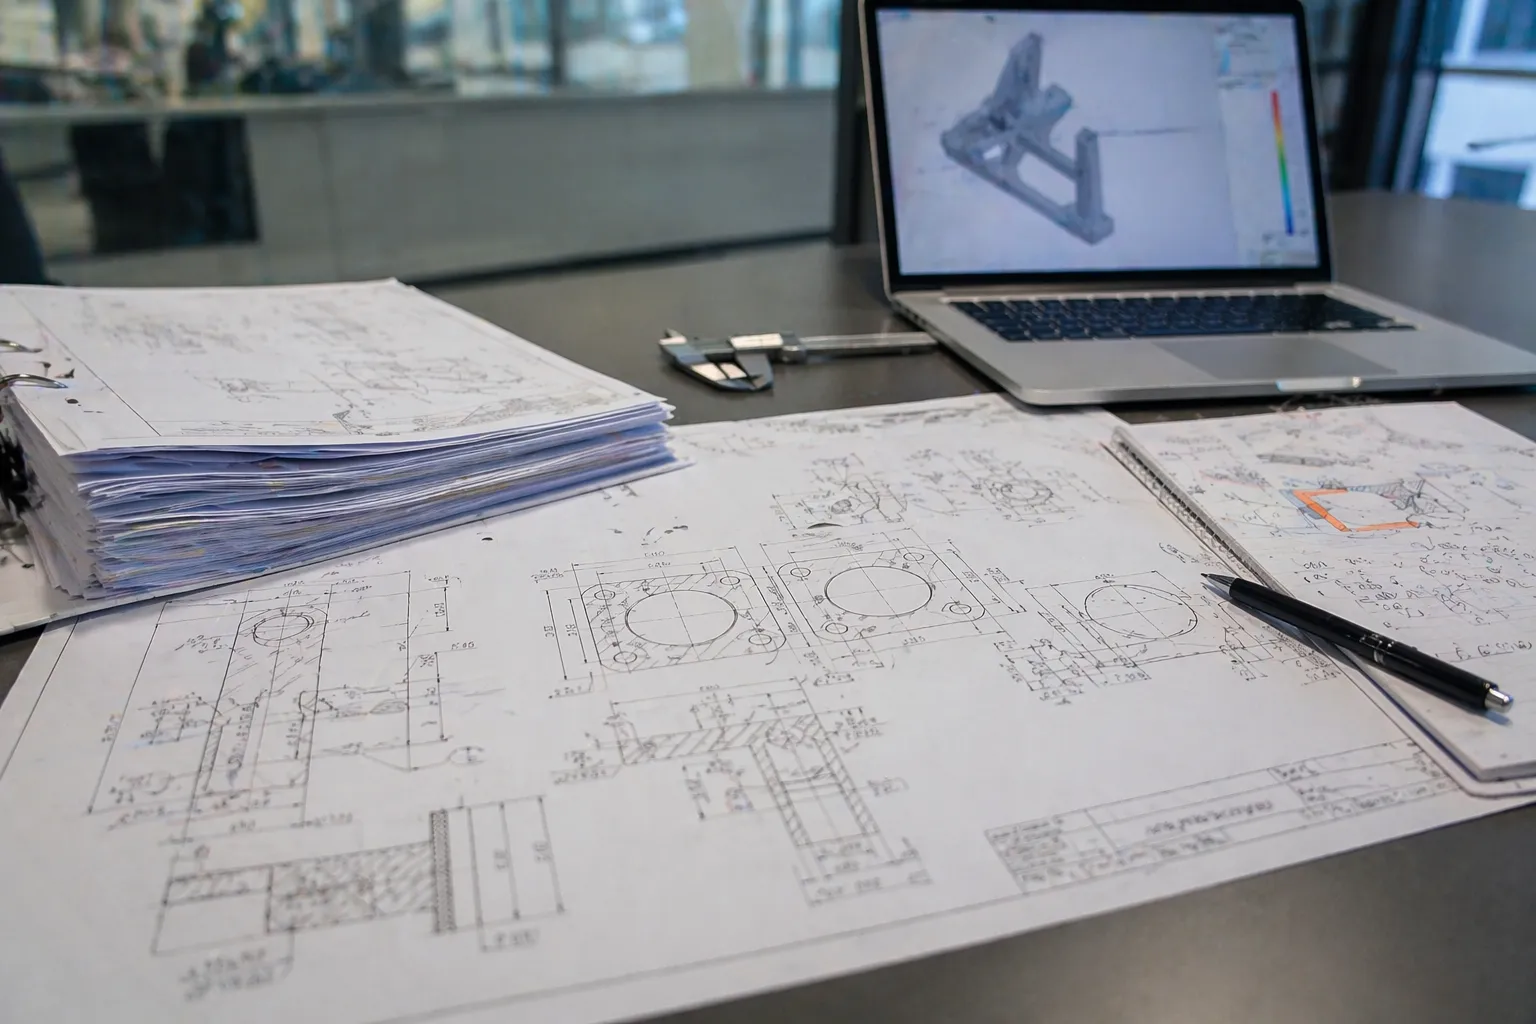
2D Drawing Analysis
Material, tolerances, surface and roughness requirements, supplier process notes, inspection requirements, labeling instructions, and basic geometry such as length, width, height, and weight.
3D Analysis
Holes, threads, weld seams, cleaner geometry, explicit manufacturing features, and a much richer basis for structured manufacturing cost calculation.
Real-Time Validation of 3D Should-Costing at Scale
The session established immediate proof of performance under real conditions.
A complex 3D CAD assembly was introduced into COVALYZE in real time. The dataset reflected typical industrial complexity: a welded structure with 44 individual components, a total weight of 40 kilograms, and an expected production cost exceeding EUR 1,600.
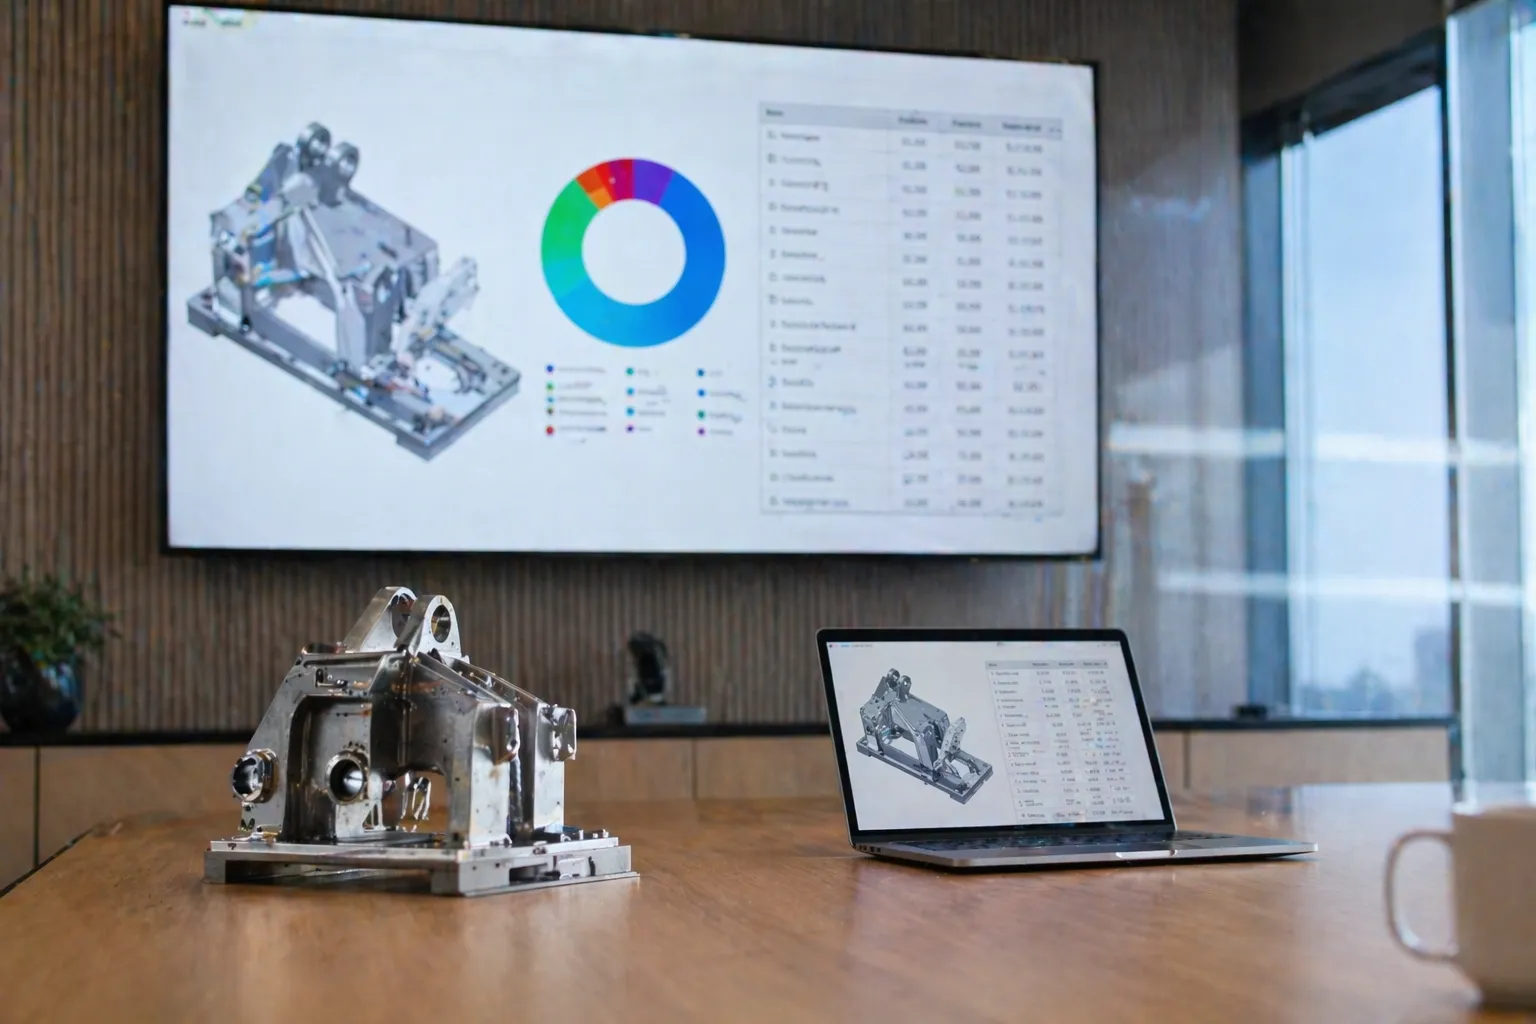
The platform generated a complete, structured 3D should-cost analysis live during the meeting, working directly from the uploaded assembly as it was.
Demonstration Output
Full 3D should-cost output generated live on a 44-component welded assembly, yielding EUR 1,600+ in calculated production cost.
44
Components
40 kg
Assembly weight
EUR 1,600+
Calculated production cost
This result directly challenged prior assumptions. The expectation had been that structured cost modeling on detailed 3D engineering data would require extensive manual preparation or interpretation. Instead, the system delivered a fully calculated, structured cost breakdown in the same meeting — ready to act on.
The conversation shifted decisively. The focus moved away from feasibility and toward application.
What began as a technical validation became a discussion on deployment potential, specifically how real-time 3D cost intelligence could:
- Increase speed and accuracy of engineering estimates
- Strengthen supplier evaluation and negotiation
- Improve quotation consistency across portfolio companies
The capability was no longer theoretical; it was demonstrated as operational and scalable in a live business context.
Why PartIQ produces reliable results at operational scale
The consistency and depth of the output reflect how COVALYZE approaches 3D geometry. Cost parameters are derived from the part structure itself, enabling repeatable results across varying assemblies and complexity levels.
Cost output grounded in the part itself
PartIQ reads the 3D model and derives cost parameters directly from the geometry. The output reflects the actual structure of the assembly, not an approximation of it.
Manufacturing process matched to part type
Part geometry informs the manufacturing route. The result is a structured cost calculation that reflects how each component would actually be produced.
Each component classified by manufacturing method
Sheet metal parts, machined components, and welded structures are each handled with the process logic that applies to them. Cost parameters activate based on how the part is made.
Outcome & Impact
The Result
The live demonstration was convincing enough that follow-up meetings were scheduled immediately with the CEO of the second portfolio company. What had looked like a technical demo became a practical roadmap for better engineering calculations and more competitive offers.
What engineers and sales teams can now do
- » Upload a reference drawing or a new 3D assembly and get a structured manufacturing-cost calculation within seconds
- » Adjust process steps directly, for example by removing paint when a new assembly will remain uncoated
- » Refine weld effort assumptions with explicit factors instead of rough rule-of-thumb surcharges
- » Scale known sheet cutting, drilling, and fabrication costs from a reference assembly to new quantities or configurations
- » Support more aggressive but better-founded quotations for highly customized customer projects
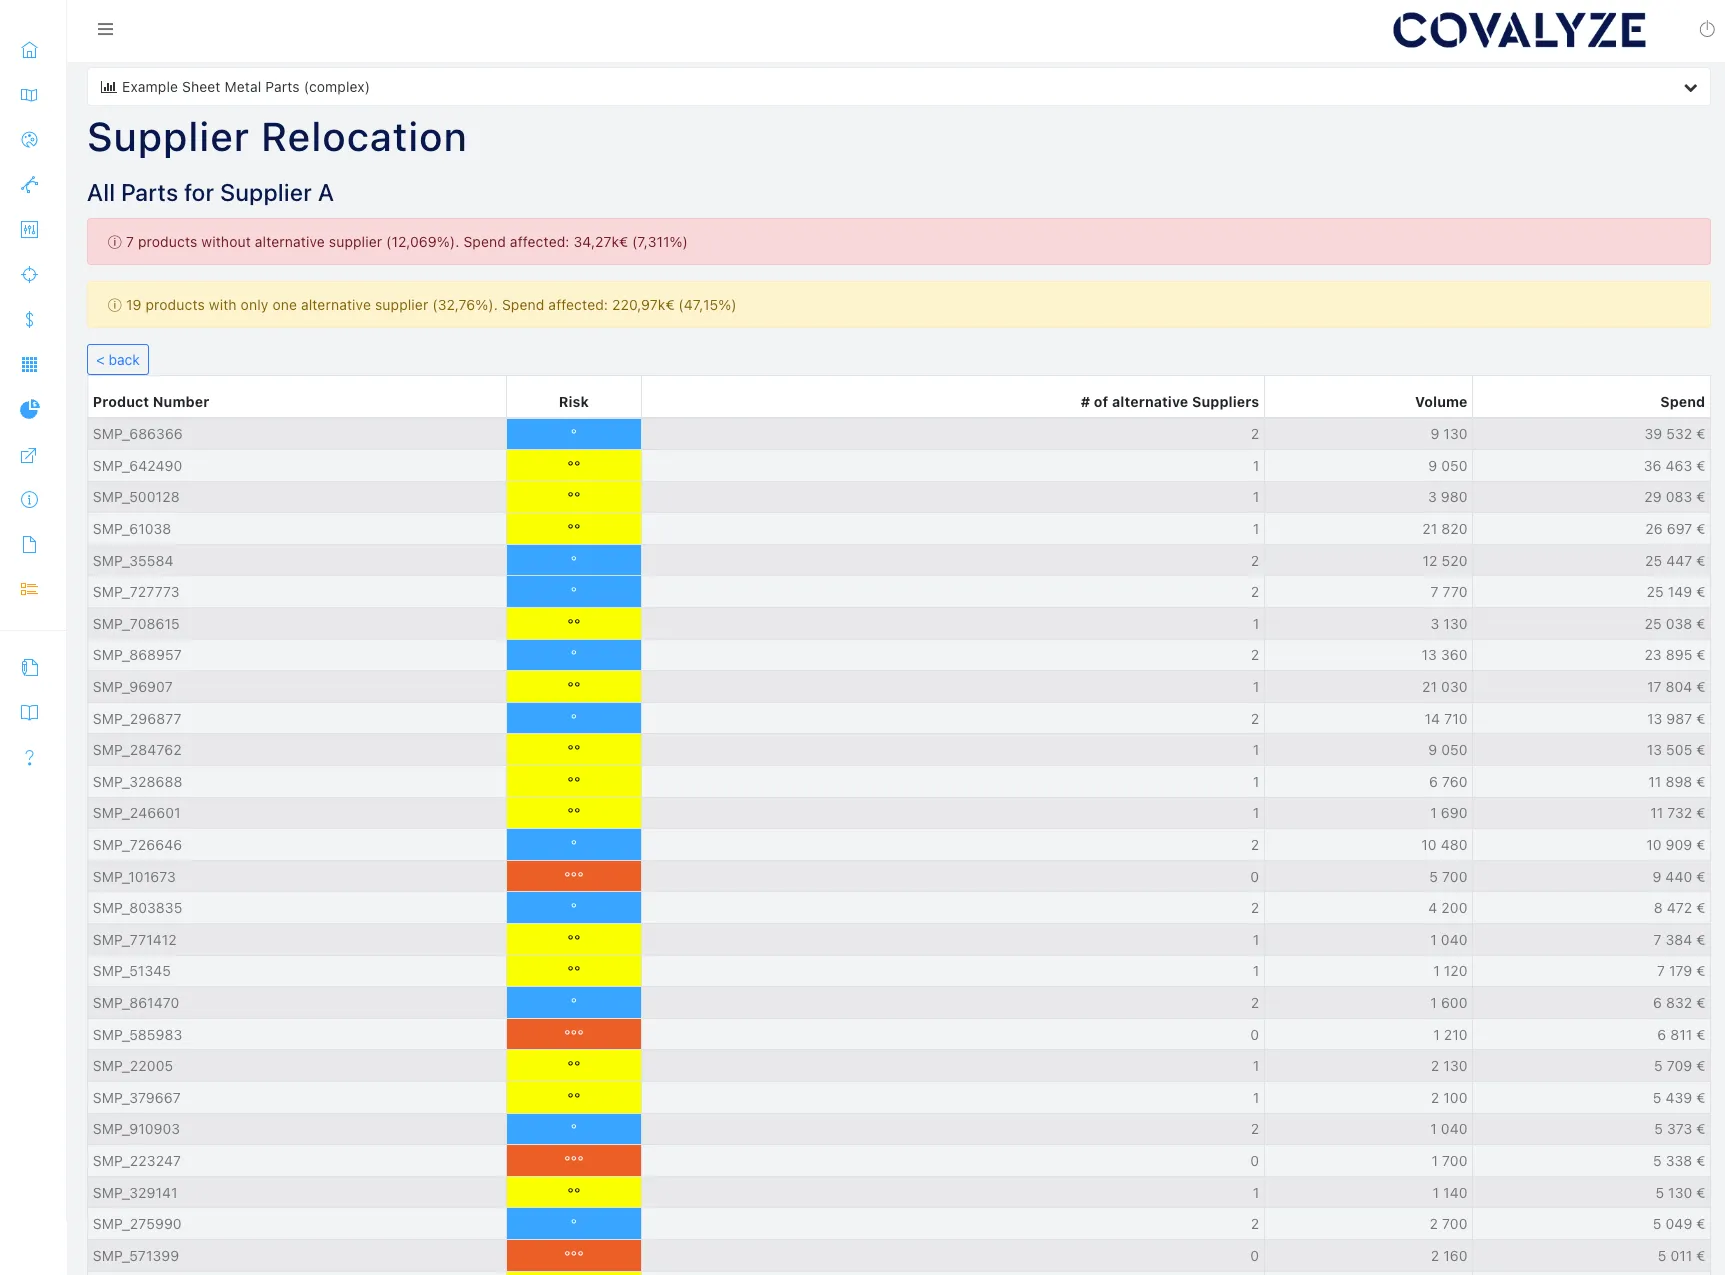
Relocation Modeling
The same platform can also evaluate sourcing and production relocation scenarios across regions. With extensible regional cost parameters for greenfield calculations, the business can compare cost structures systematically instead of treating location decisions as one-off spreadsheet exercises.
Provided by the investor during the meeting and costed retrospectively with PartIQ.
Complete structured cost breakdown generated during the investor meeting, without pre-processing or preparation.
A commercially relevant welded construction with multiple manufacturing steps.
The live demo part was smaller than earlier projects, but still complex enough to prove the point.
Should-cost output produced within seconds during the investor discussion.
A typical 3D model yields far more structured costing data than a 2D drawing.
Historical baseline that proved the commercial relevance of the category.
Nearly 90 percent quality reached despite heterogeneous 2D drawing quality.
The earlier dataset included very large welded constructions in logistics applications.
The meeting showed that 3D-based should-costing is no longer a technical curiosity. It is a decision-ready workflow for engineering, sales, and sourcing.

“Before this kind of analysis, new project costs were often estimated by comparing a new assembly with a previously built one and applying a rough surcharge factor. After the demo, the path forward was clear: base quotations on a structured manufacturing calculation instead of approximation. That creates faster offers, better sourcing decisions, and a much stronger commercial position for project-driven manufacturers.”