Opening Brief
At a Glance
Our Client
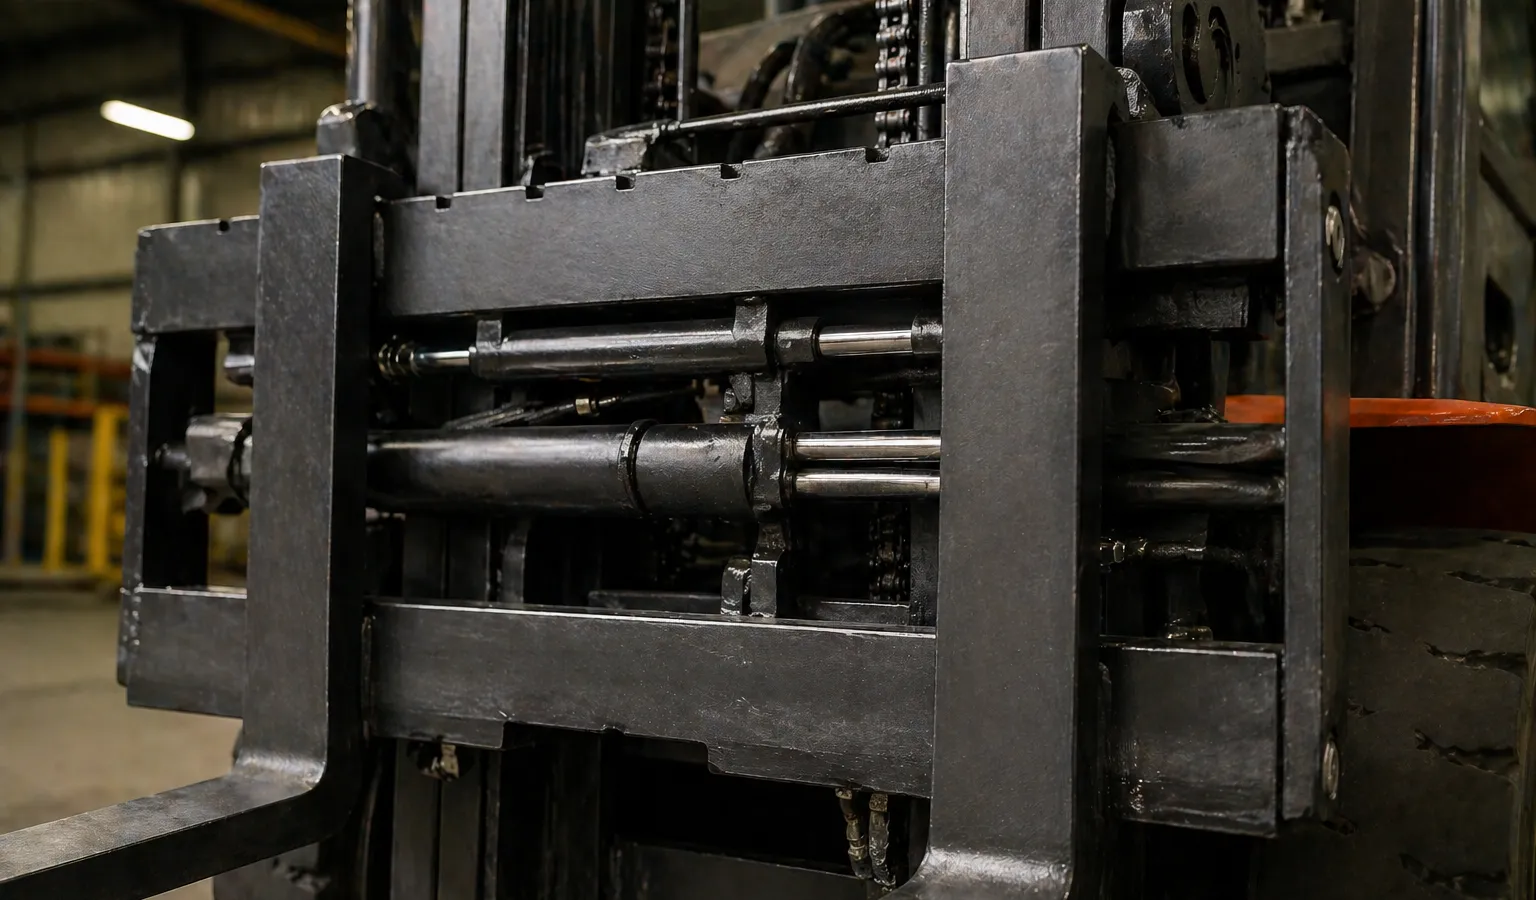
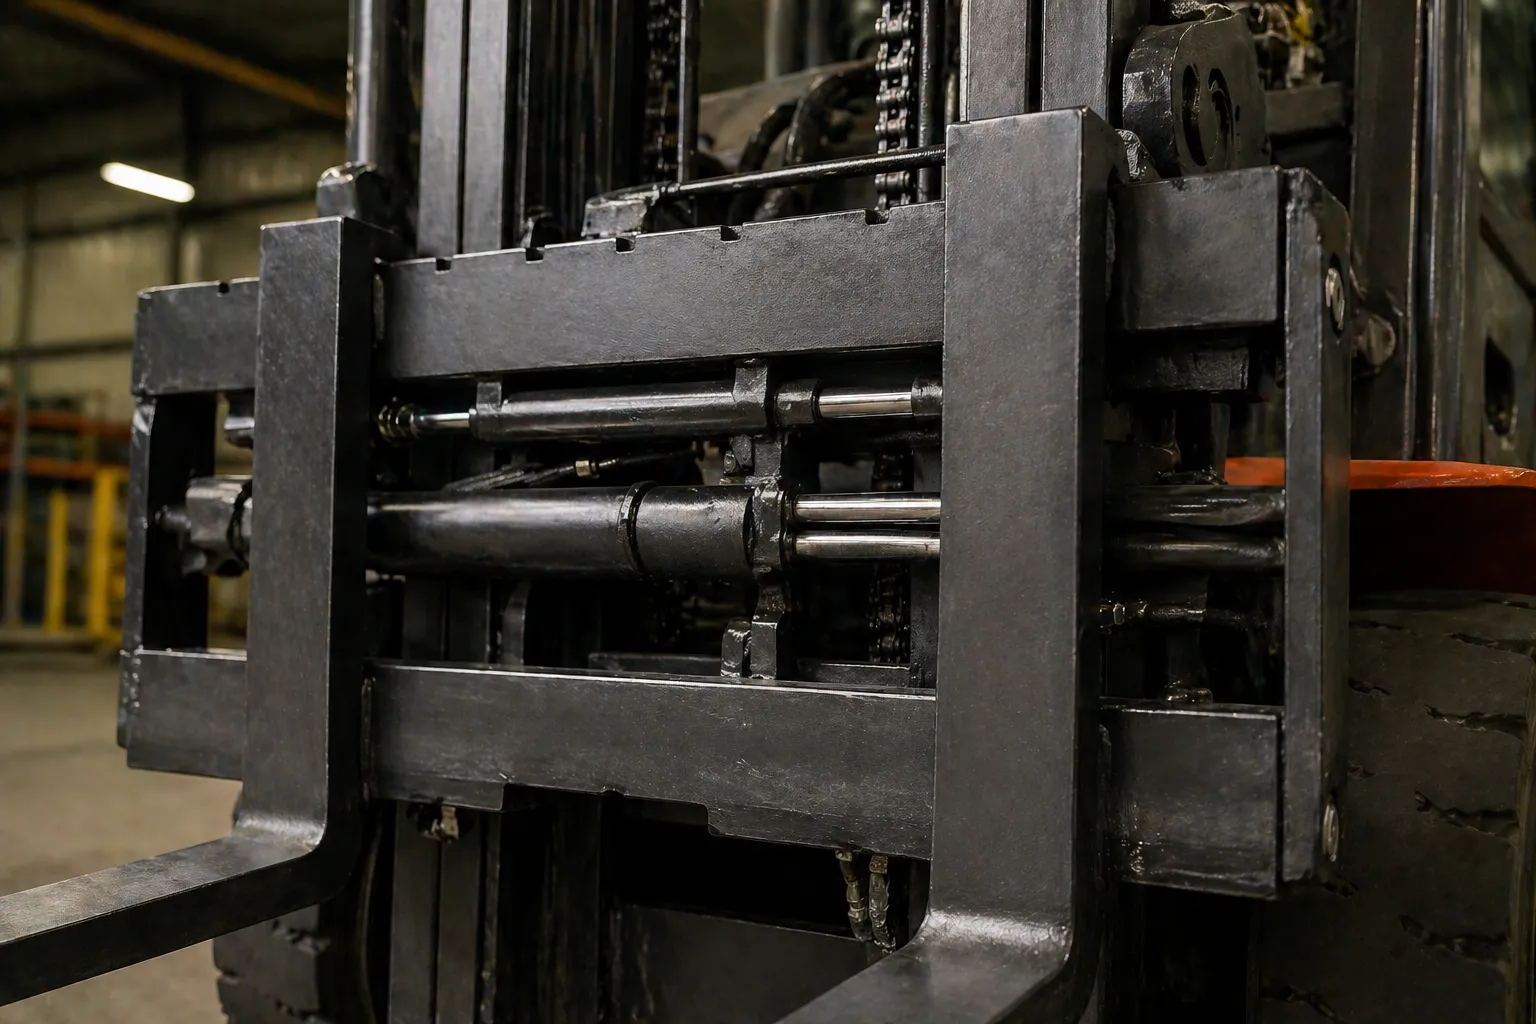
One of our earliest client engagements was with a major German mechanical engineering company specialising in special-purpose logistics vehicles. The commodity selected for the initial analysis was forklift carriages — the assembly mounted on a forklift's front plate that allows operators to individually adjust the spacing between the forks.
The engagement was initiated directly at C-level through the CTO, who directed the project to the Engineering and Cost/Value Engineering functions. The project lead was the head of the Cost/Value Engineering department — a team genuinely open to new analytical approaches.
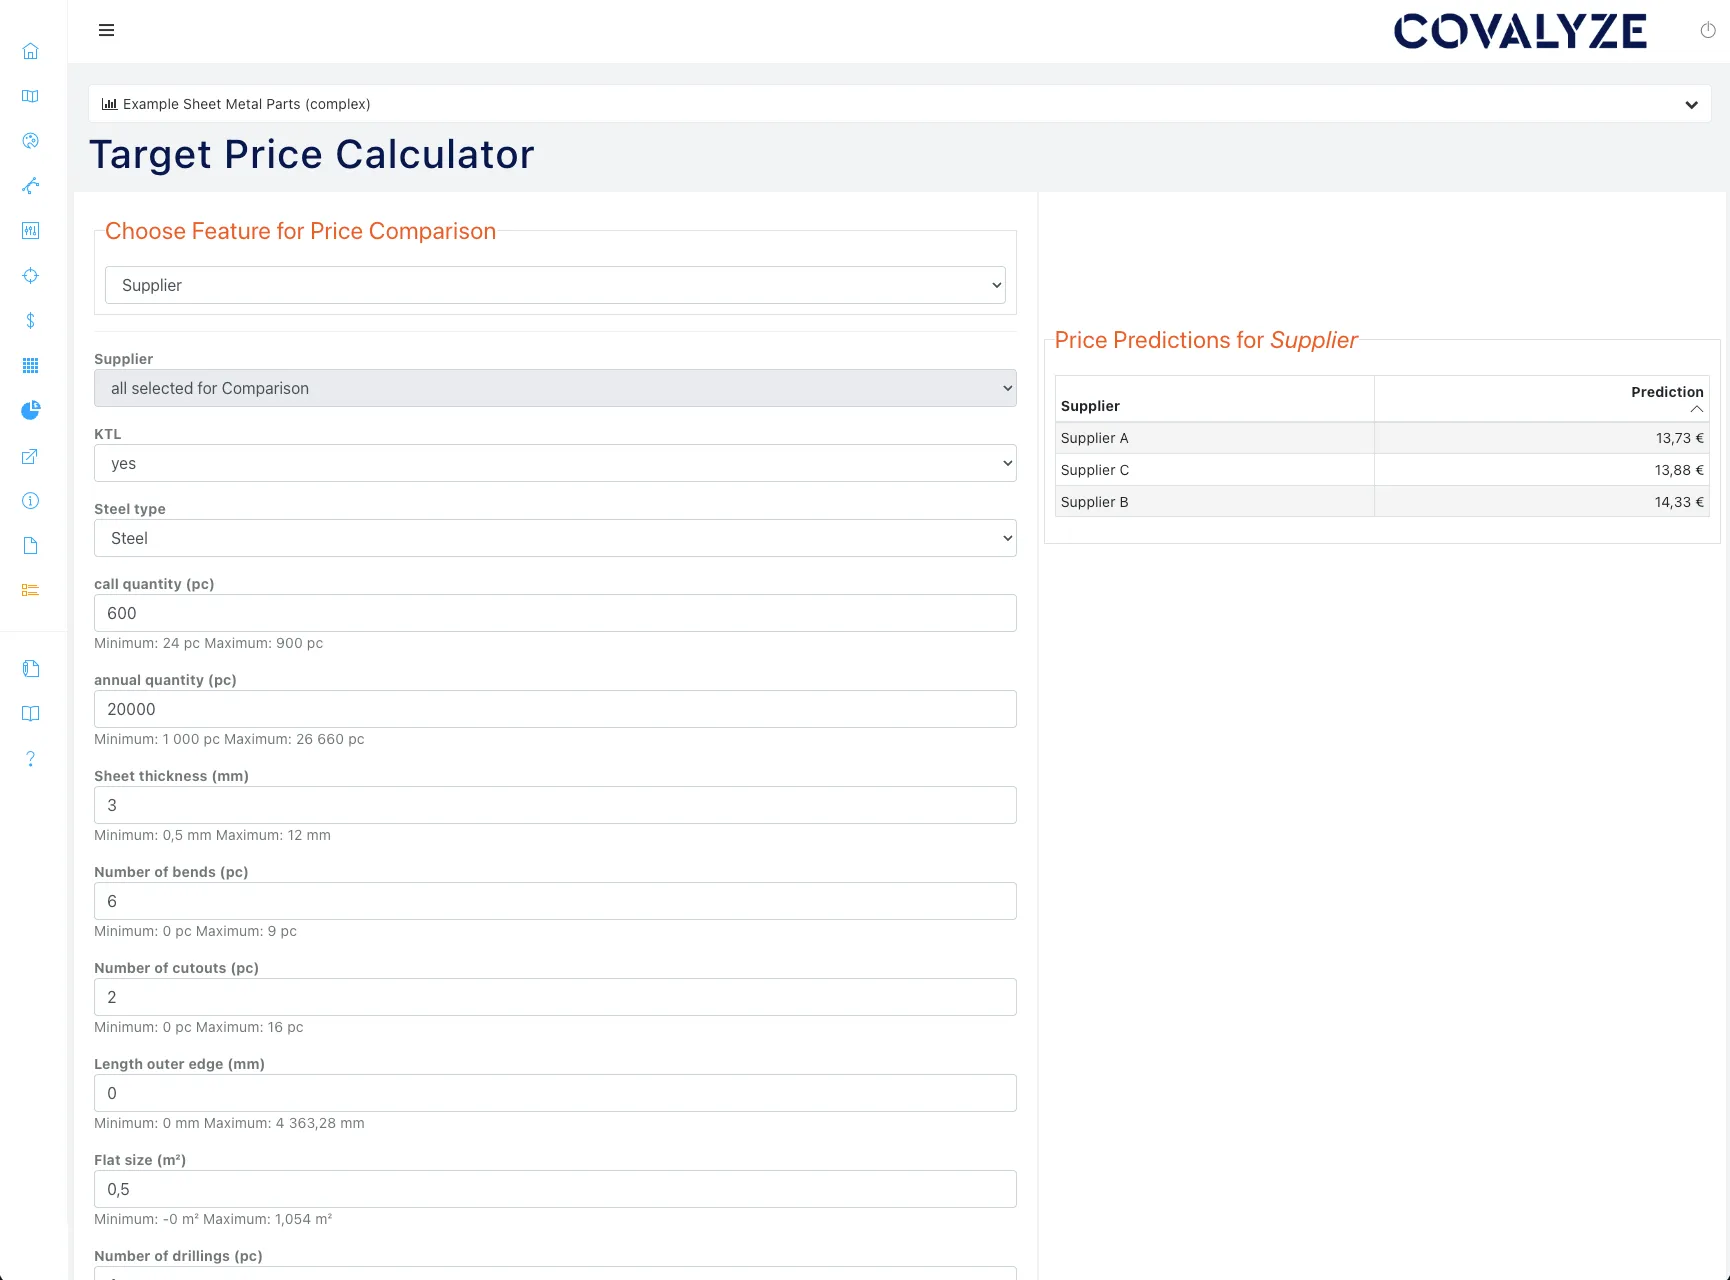
Using COVALYZE Analytics and — in the follow-up — COVALYZE PartIQ, the team delivered reliable target cost models and a full part-level cost structure analysis that replaced weeks of manual effort with an automated, seconds-fast process.
Key Figures
Full category spend for the forklift carriage commodity.
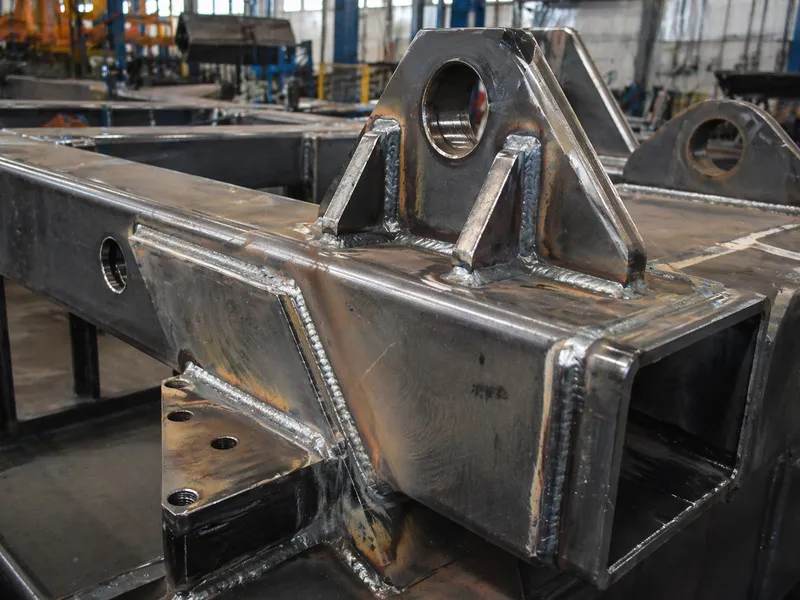
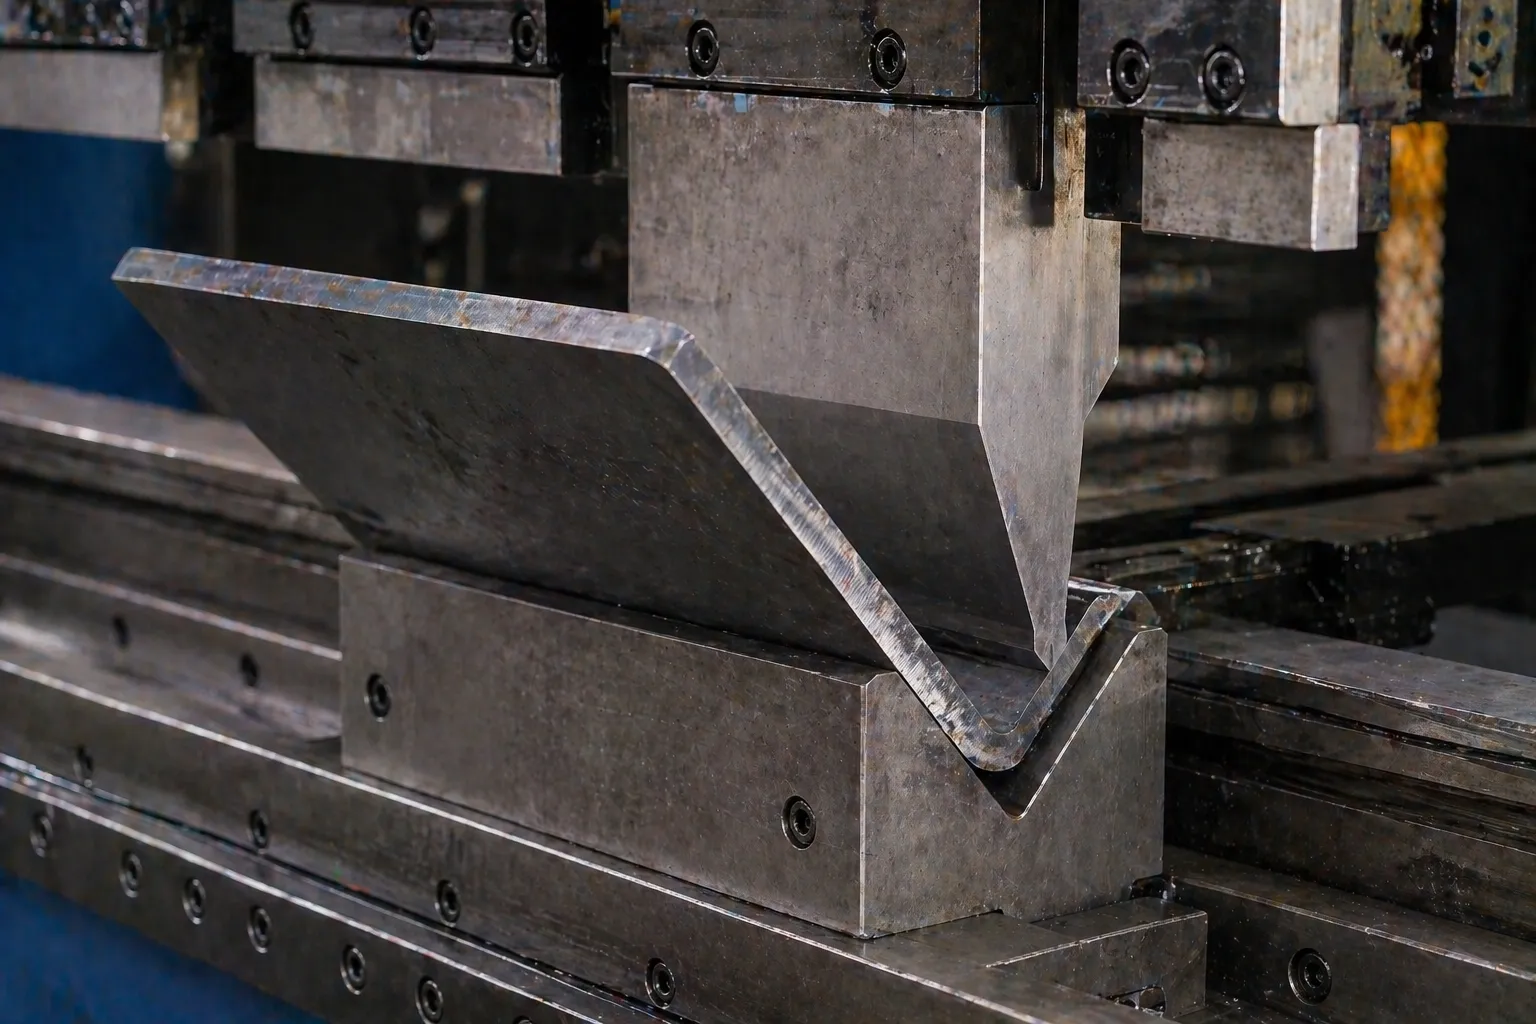
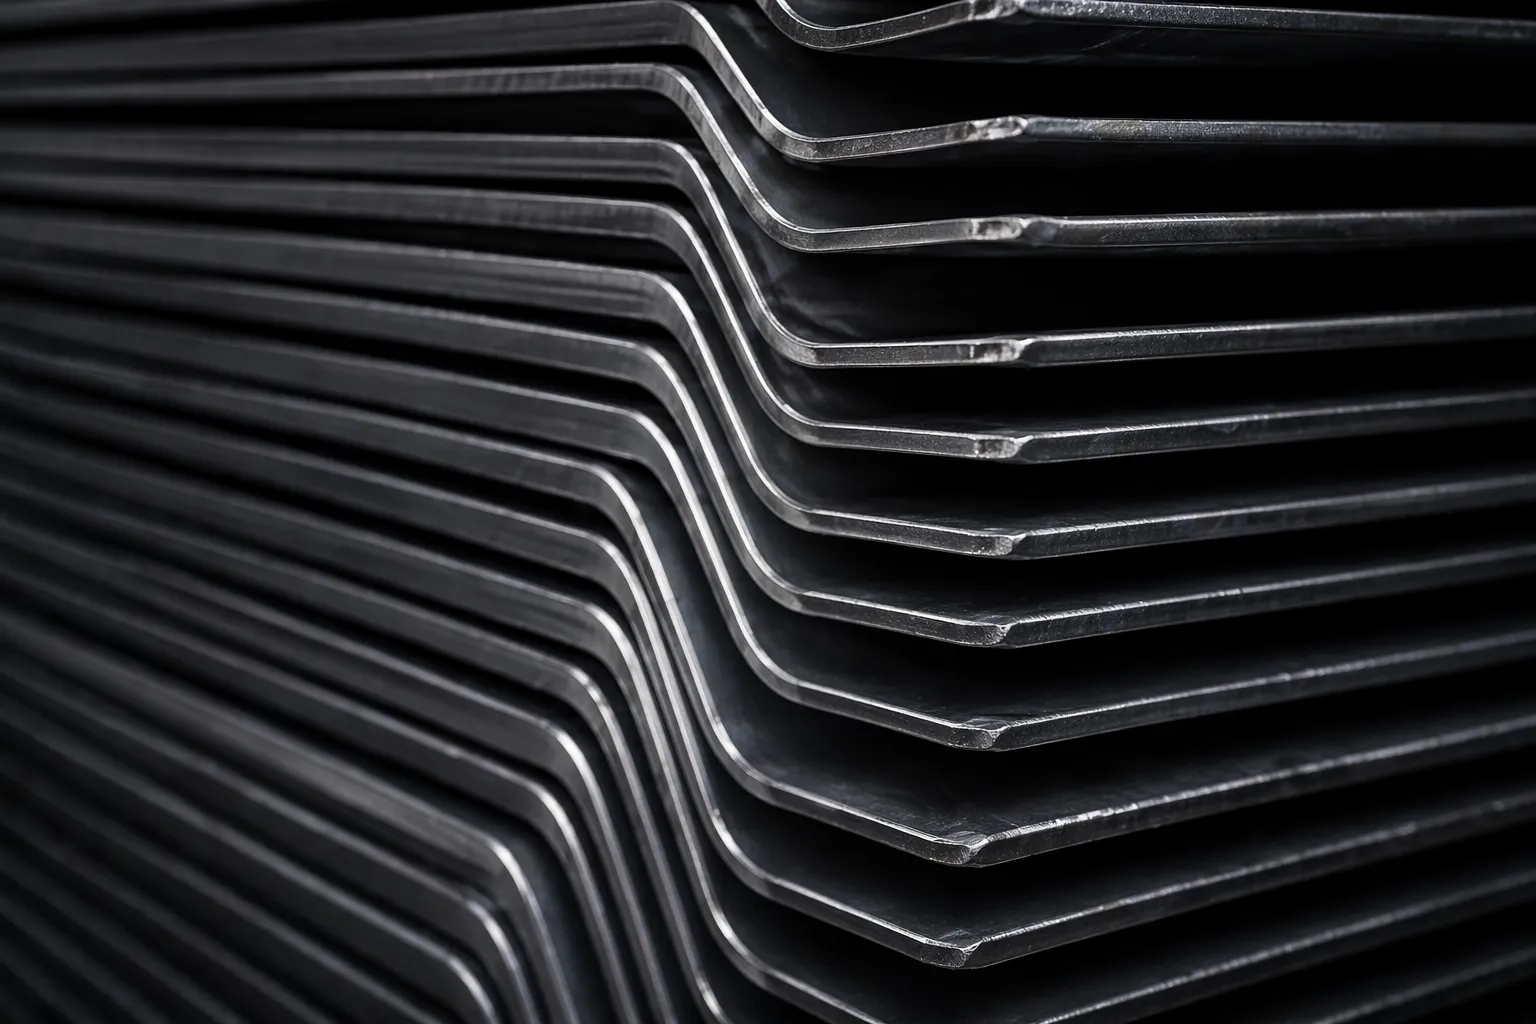
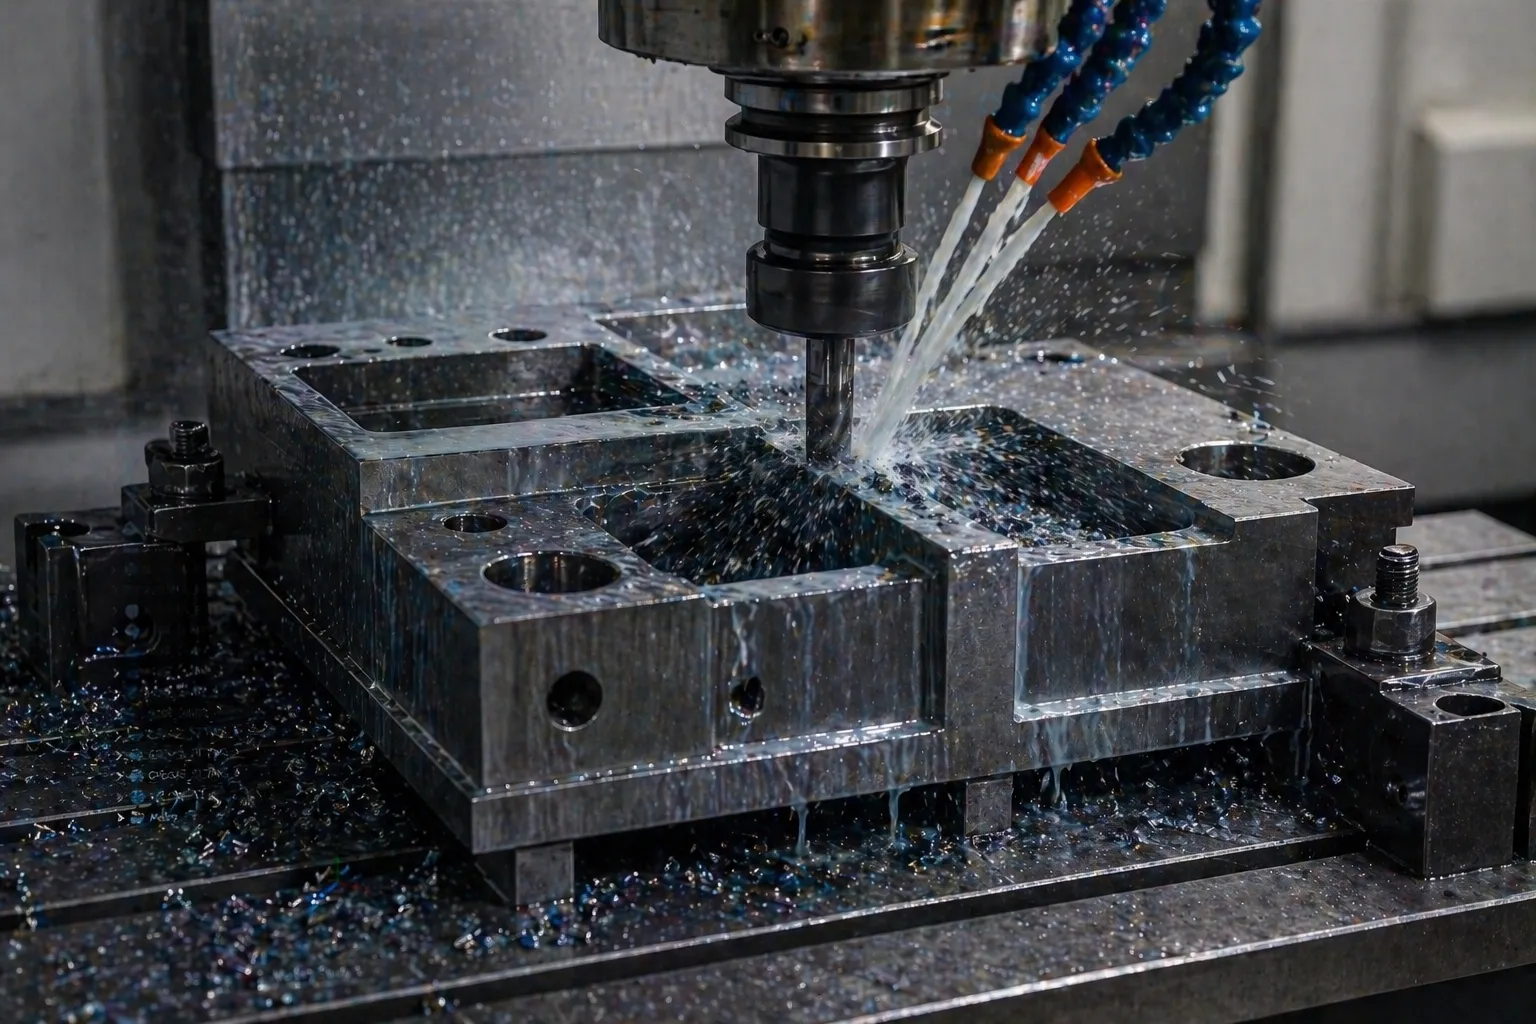
Heavy, complex multi-component welded structures.
Maximum component count per individual carriage design.
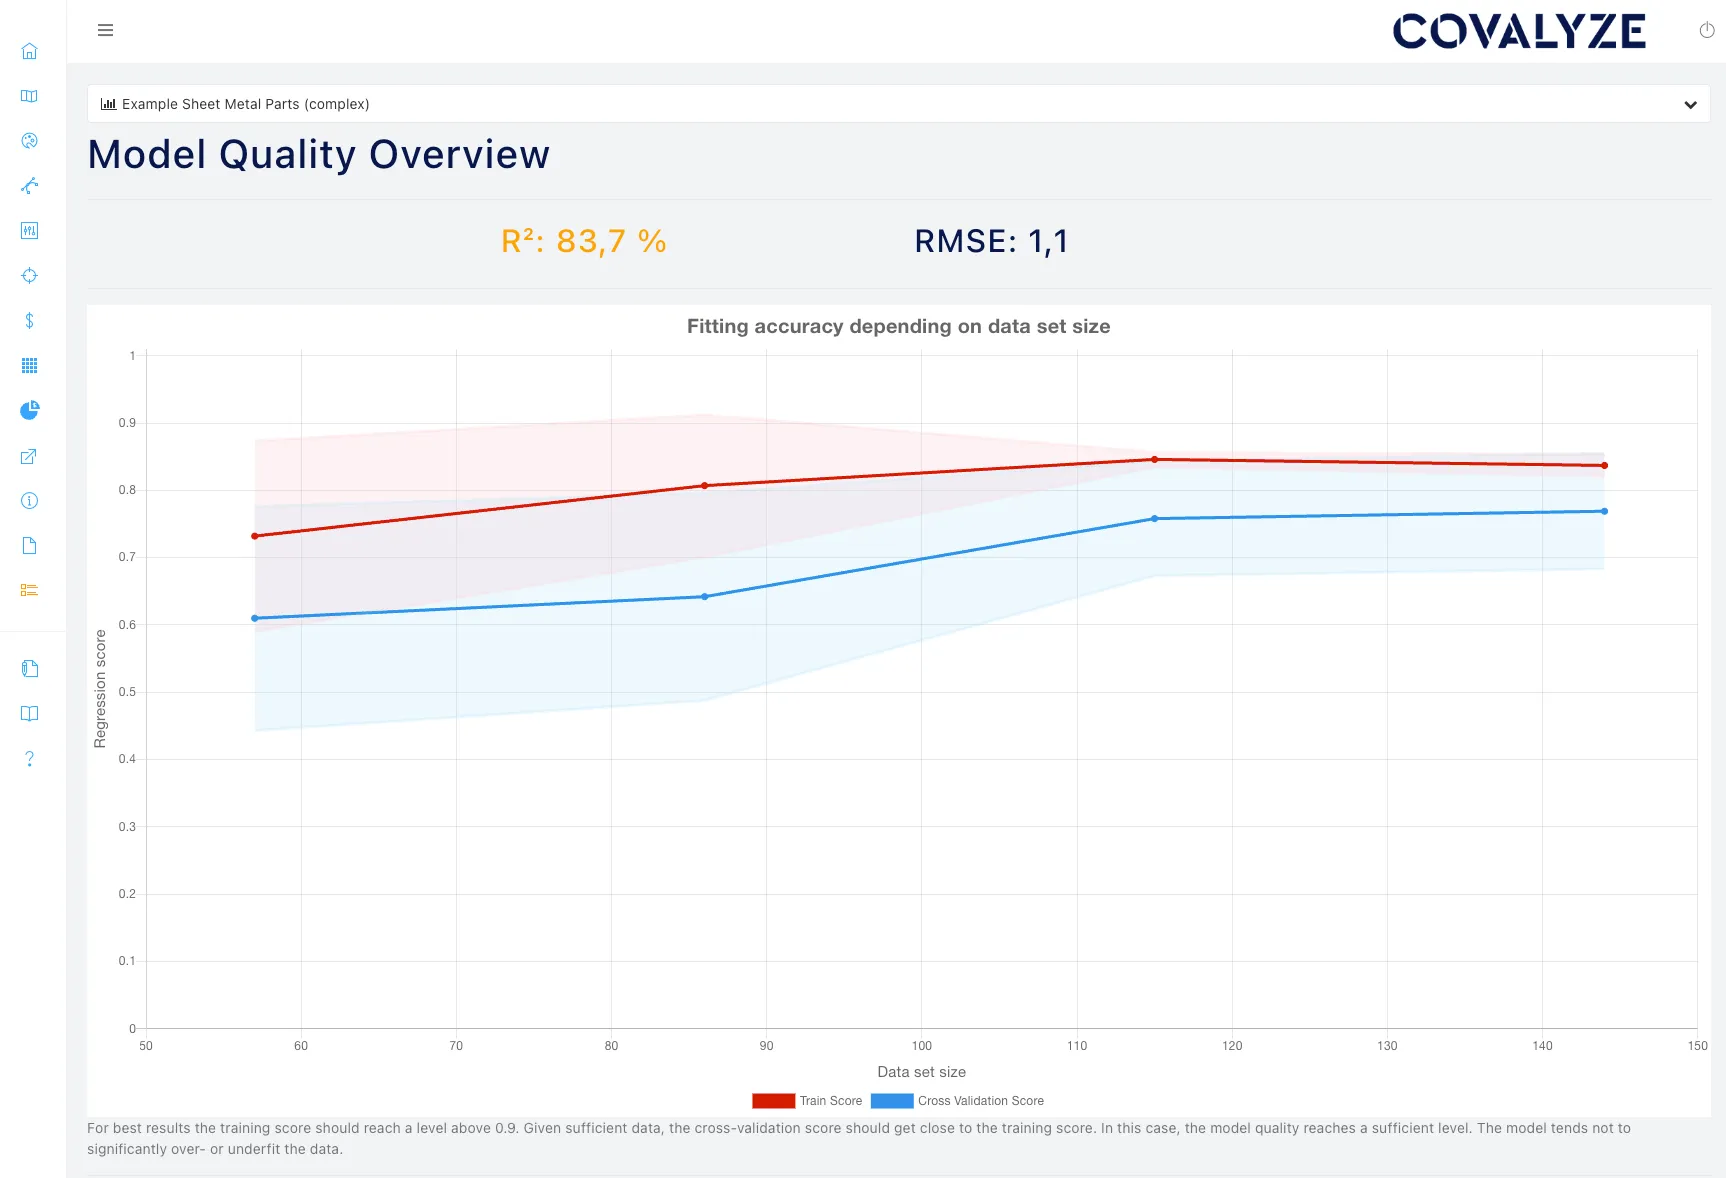
Coefficient of determination achieved despite high part complexity.
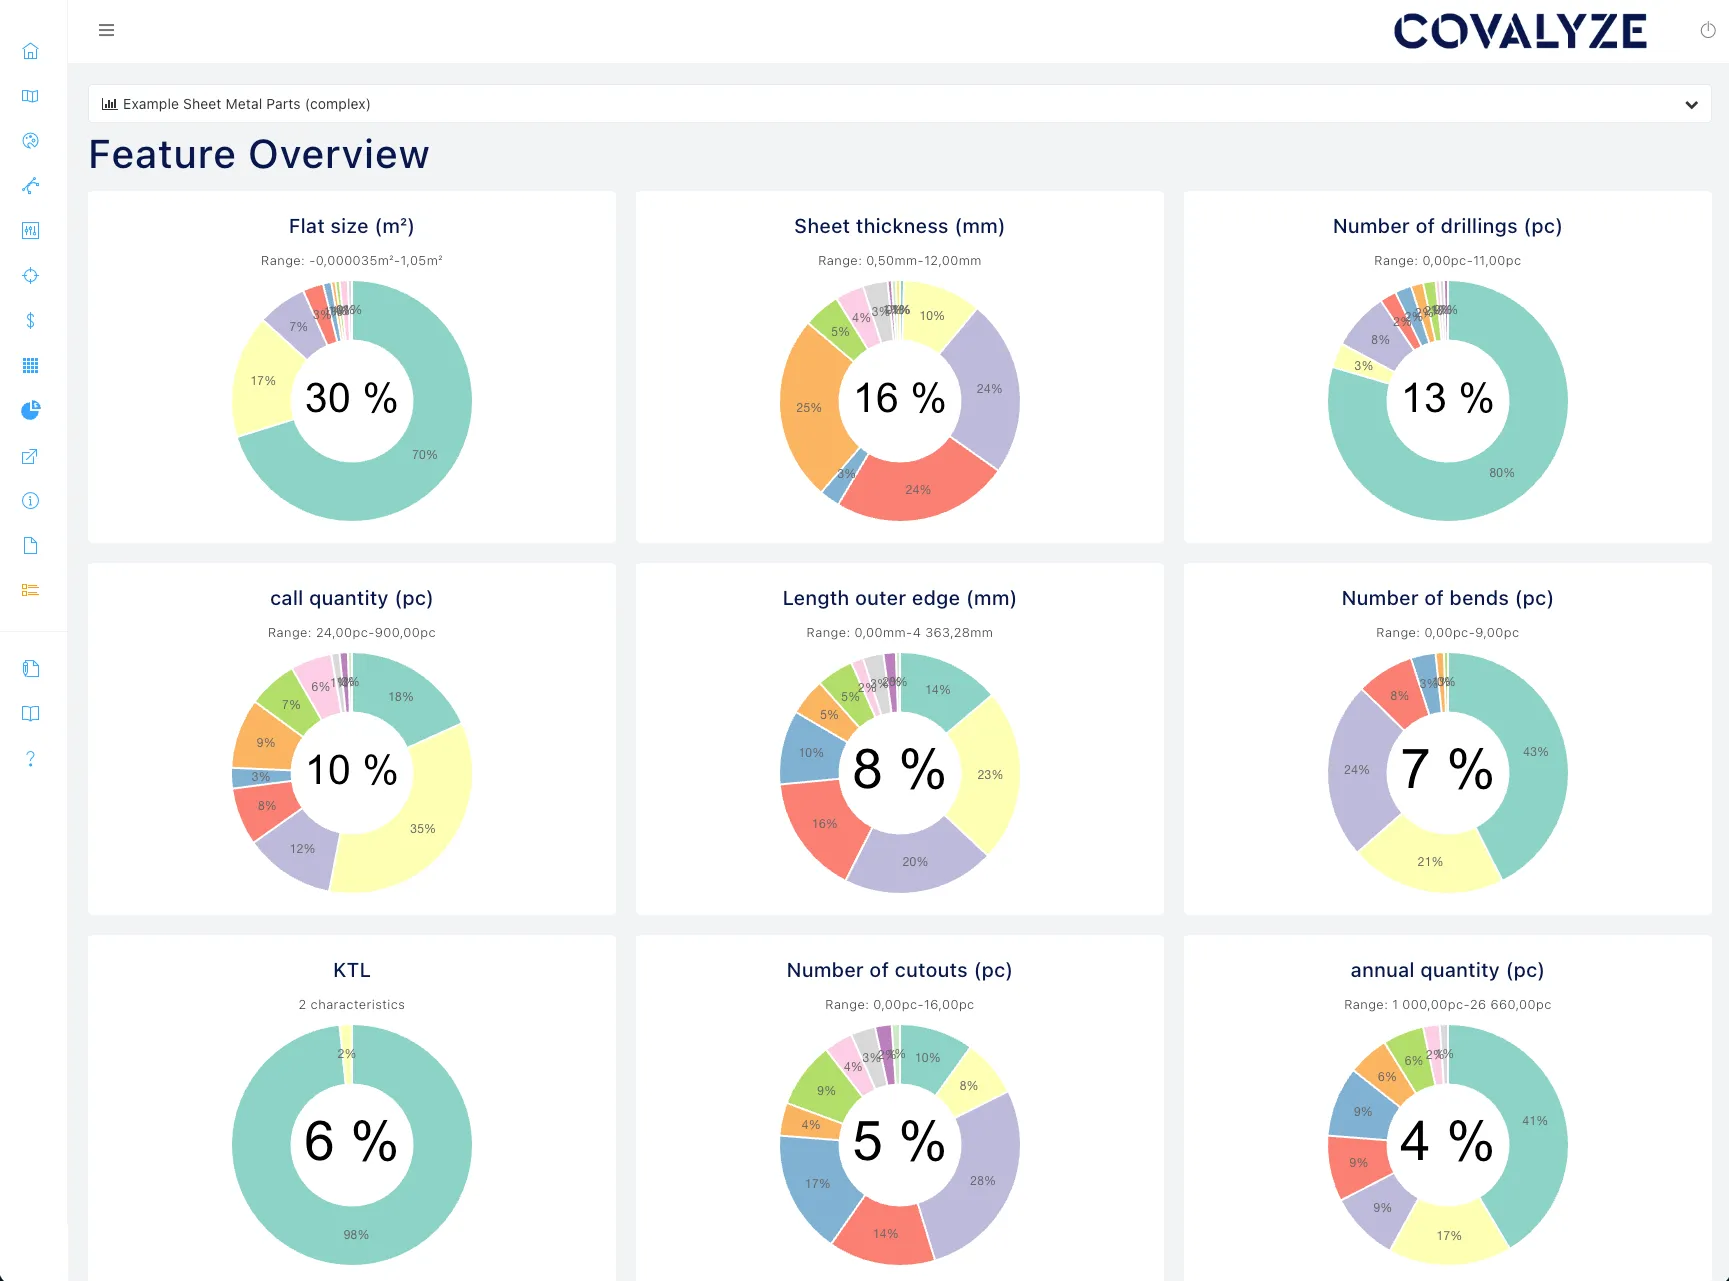
Mast upright thickness, front plate type, and front plate height explain the majority of cost variance.
Full cost structure per assembly — versus approximately one week with manual methods.
Problem Frame
The Challenge
Forklift carriages are deceptively complex. What appears to be a standardised industrial component conceals a wide spectrum of structural designs, each engineered to specific load, geometry, and surface requirements.
Engineering Complexity Across the Category
The 75 assemblies in scope varied significantly across multiple structural dimensions:
- » Mast upright thickness (stepped increments: 2.5 / 3 / 3.5 cm up to 6 cm)
- » Front plate design type (single-piece casting, simple welded assembly, or complex welded assembly)
- » Front plate height (typical variants: 70 / 90 / 120 cm)
- » Lifting capacity range from a few hundred kilograms to 8 tonnes
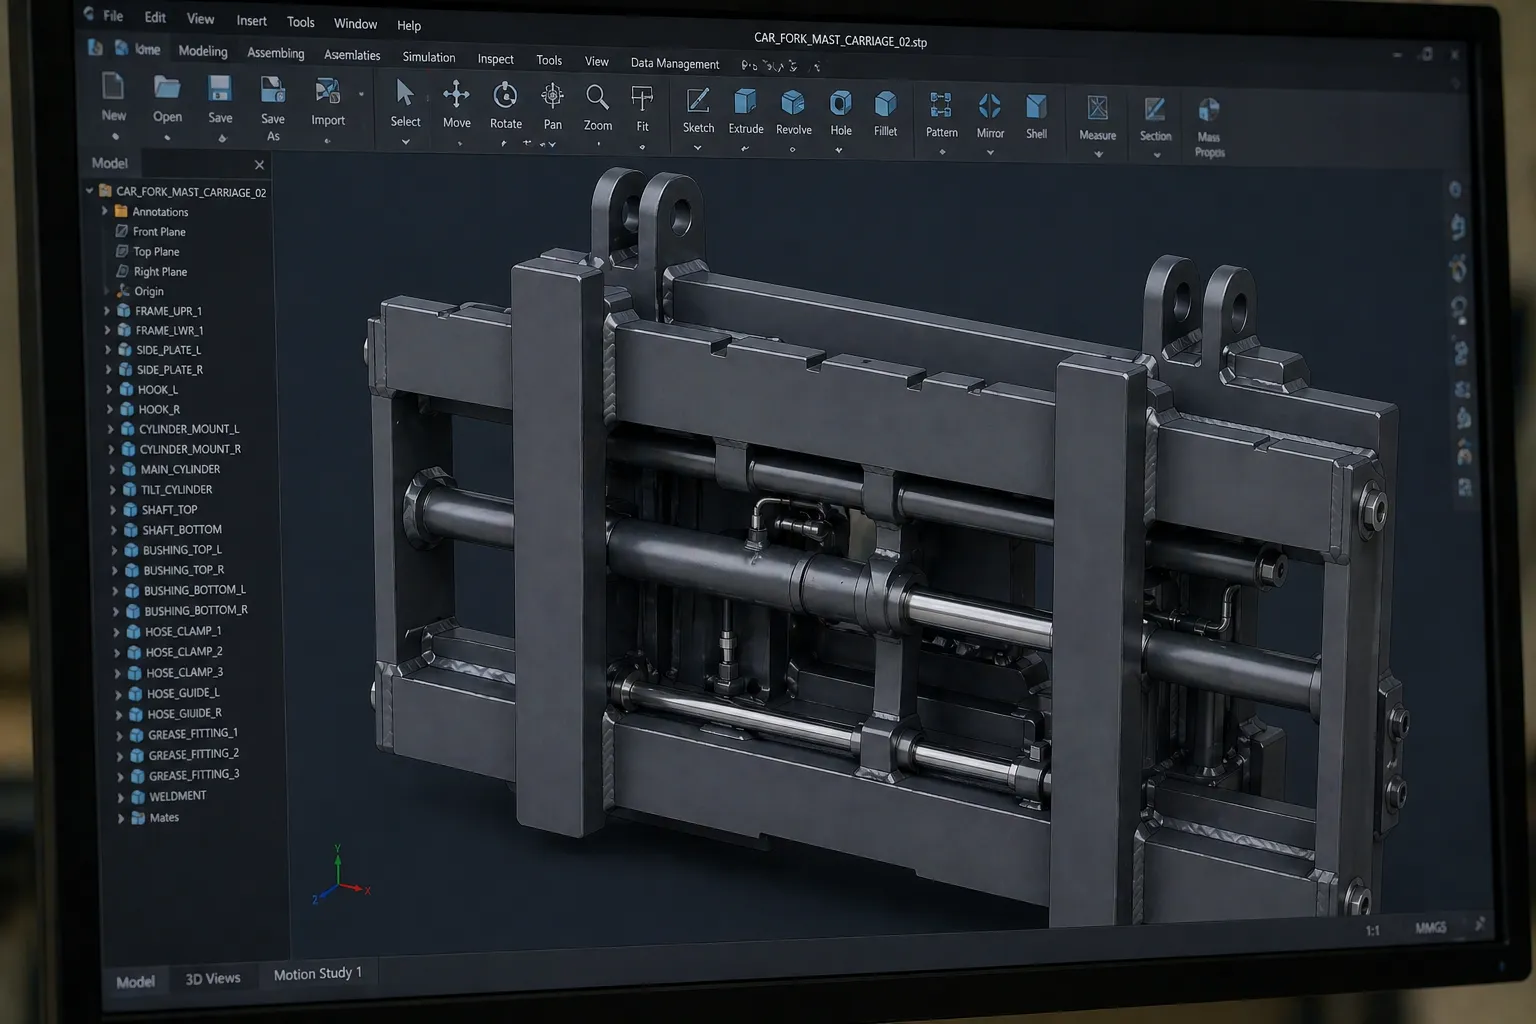
- » Up to 15 individual components per assembly
- » Mix of 2D drawings (material, part number, surface treatment) and 3D drawings
Costing Bottleneck
With each assembly comprising up to 15 individual components — and requiring separate calculation of raw material, sawing, bending, welding, milling, and assembly — a traditional bottom-up cost calculation required approximately one week per part for an experienced internal value engineer.
At the time of the initial analysis, 3D files could not be processed automatically. Dimensions had to be measured manually in a 3D viewer, noted by hand, and transferred into Excel. A team of three required nearly one full week to complete the measurement phase alone.
Execution Design
Our Approach
Statistical Cost Modelling
Using COVALYZE Analytics, the project team built a statistical regression model from the manually extracted dimensional data and supplier pricing — identifying the true structural cost drivers across the category.
Model Performance
Despite the high structural complexity of the assemblies and only 72 usable data points, the model achieved a coefficient of determination of over 92% — with parameters that were fully interpretable and confirmed by the Engineering team and CTO.
Key Cost Drivers
The vertical load-bearing element in the forklift mast; stepped at 2.5 / 3 / 3.5 … up to 6 cm.
Three variants: single-piece casting, simple welded assembly, complex welded assembly.
Typical variants: 70 / 90 / 120 cm.
Lesser statistical influence.
Counterintuitive Finding
Why isn't nominal lifting capacity the primary cost driver? At first glance, one would expect rated capacity (8t, 6t, 5t…) to be the dominant variable. Statistically, however, it correlated less strongly than mast upright thickness.
The reason: Engineering had deliberately accepted over-engineering as a means of reducing variant complexity — for example, 6 cm uprights were approved for both 8-tonne and 3.5–5-tonne applications. The physical design characteristic (upright thickness) is therefore a more precise cost indicator than the nominal load rating. The model surfaces what the spec sheet obscures.
Similarly, order quantity showed no statistically significant price influence — all parts fell within a small-series production range (a few hundred to a maximum of 1,000–2,000 units per year), where quantity discount curves are essentially flat. This is a characteristic distinction between statistical regression and traditional bottom-up costing assumptions.
Re-Analysis with COVALYZE PartIQ
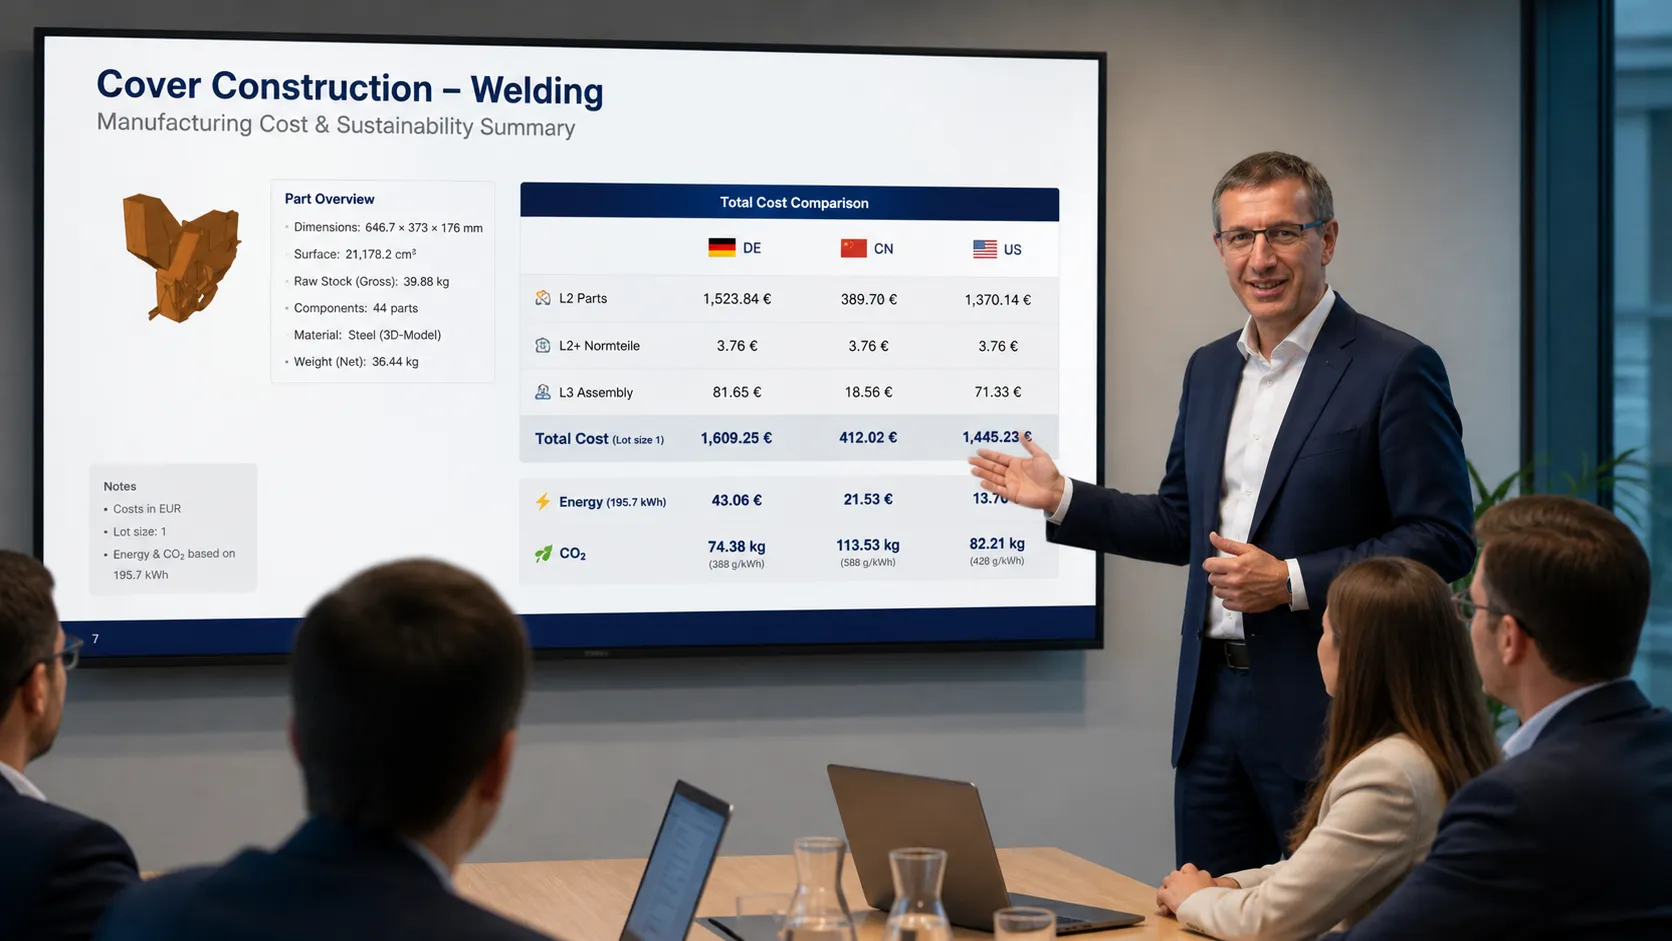
The same 75 assemblies were subsequently processed as files through COVALYZE PartIQ — delivering a complete, part-level cost structure analysis automatically.
Full Manufacturing Cost Breakdown
For each assembly, COVALYZE PartIQ resolved every individual manufacturing step and component:
-
 Raw semi-finished material
 - Sawing
-
 Bending
 -
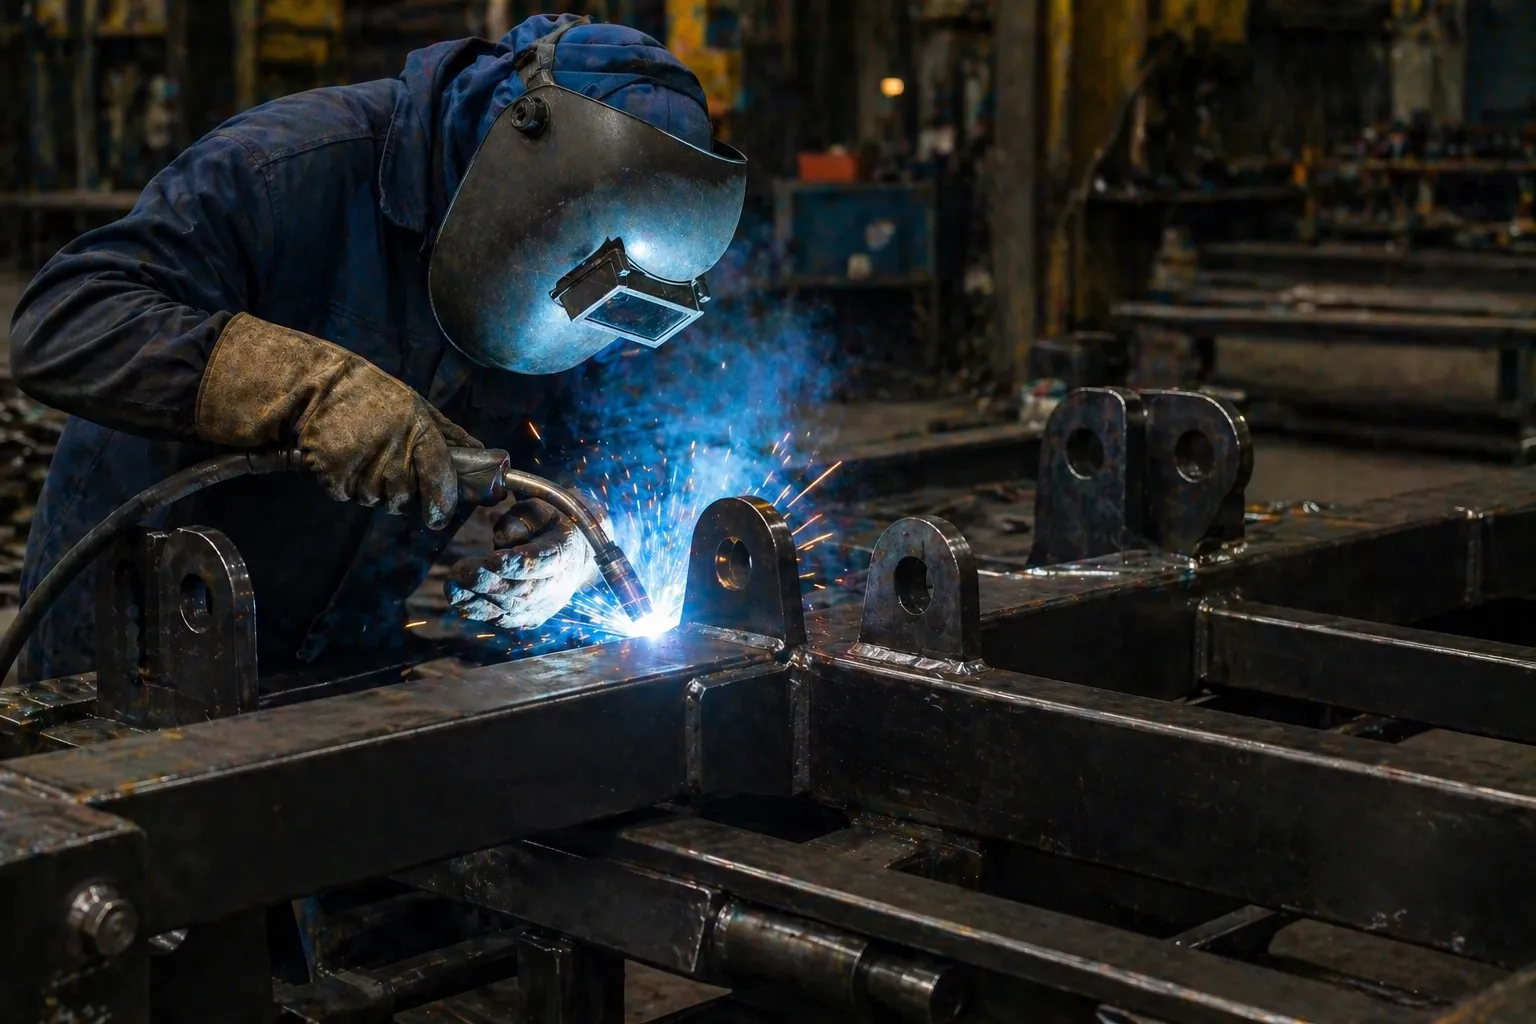 Welding
 -
 Milling
 - Full assembly process
Outcome & Impact
The Result
By combining a statistically robust cost model with COVALYZE PartIQ automation, the client gained reliable target costs for every forklift carriage variant — and a foundation for procurement-level transparency at scale.
Engineering speed
Seconds
Target cost determination moved from manual bottom-up effort to automated file-based analysis.
Validated model
92%+
Engineering and CTO validation confirmed the cost drivers were technically interpretable.
Category scope
75
The complete forklift carriage sample became available for target pricing and negotiation preparation.
Immediate Engineering Value
The first project phase delivered tangible savings — though limited, as prices had already been well-negotiated and few outliers existed. The primary value was drastically faster target cost determination for Engineering: instead of laborious bottom-up costing for each assembly, the model delivered reliable target prices from a handful of structural parameters.
Both the Engineering team and the CTO confirmed the model parameters and validated the business value. The company is currently evaluating whether to replace its established PLM-based costing tool — provided by a major German enterprise software vendor — with COVALYZE.
Executive Perspective

“This project illustrates precisely why automation matters: the same analytical result that once required a week of skilled manual effort is now available in seconds. That shift changes what is commercially feasible — not just for cost engineers, but for entire procurement organisations.”
Automated part-level cost analysis enables organisations to operate the way large corporations already do — at any scale.
Levelling the Playing Field
The automation of cost analysis from files enables mid-sized industrial companies to work with the same analytical depth that large corporations achieve with hundreds of value engineers. The vision of the "transparent supplier" — knowing exactly which machines produce each part and what each component should cost — is no longer the exclusive domain of automotive OEMs and global technology companies. It becomes structurally achievable for any organisation with access to its own drawing data.
Procurement Capabilities Unlocked
Key Figures
Full category spend for the forklift carriage commodity.
Heavy, complex multi-component welded structures.
Maximum component count per individual carriage design.
Coefficient of determination achieved despite high part complexity.
Mast upright thickness, front plate type, and front plate height explain the majority of cost variance.
Full cost structure per assembly — versus approximately one week with manual methods.