DARIN · COST OPTIMIZATION METHODOLOGY

You pay more for your parts than they need to cost.

DARIN shows how much — per part, in euros, with the calculation behind it. Five levers, each one its own number, so you can see not just that a price can come down but where.

WHAT DARIN DELIVERS

A target price per part — and the five levers that get you there.

6.5% Average savings potential identified*
€1B+ Analyzed spend across 250+ categories
5 Levers Quantified separately per part
1 Day First calculation for one documented part

SOUND FAMILIAR?

Prices are negotiated. Costs are decided much earlier.

A Quotation Shows Price, Not Cost

You can compare offers against each other and against last year. What you cannot see is what the part should cost — so a price increase either gets accepted or argued about, but never checked.

Cost Is Fixed Before Anyone Sees It

By the time the quotation arrives, the design is frozen and the supplier is nominated. The decisions that set most of the cost — material, tolerances, process, quantity — were made when nobody could price them.

Three Functions, Three Sets Of Assumptions

Engineering, procurement and the plant each hold part of the cost picture, in different files. Without one shared calculation, the discussion is about whose number is right instead of what to do.

What DARIN is

A method for calculating what a part should cost — and what to change.

DARIN is COVALYZE’s structured cost-optimization methodology. It combines automated technical-data extraction, should-cost calculation and scenario analysis to identify and quantify five cost levers for manufactured parts. You can use it through a managed assessment, a Fast Track commodity project, or continuously inside COVALYZE Analytics.

It is not a fourth product to buy. PartIQ reads your technical documents, COVALYZE Analytics connects them with your commercial data, and DARIN is the method applied on top: build the should-cost from the bottom up, then test five places where that cost can come down.

The calculation Bottom up, not last year minus x

The calculation runs from the ground up rather than as a discount on last year's price: material, machine, labour and setup time, plus the overhead factor of the producing country. What comes out is a target price — the number the part is allowed to cost.

  1. 01 Material Design attacks this
  2. 02 Machine time
  3. 03 Labour time
  4. 04 Setup time
  5. 05 Overhead factor of the producing country
Target price The number the part is allowed to cost.
Result
The five letters are the five levers

Select a lever to see what it attacks

The levers in numbers

Each lever is its own number.

What a lever changes in the calculation, and what that looks like on a real part — so you can see which one is worth the effort here and which one is not. The values shown are examples from the FTE-0001 sheet-metal part in the DARIN calculator.

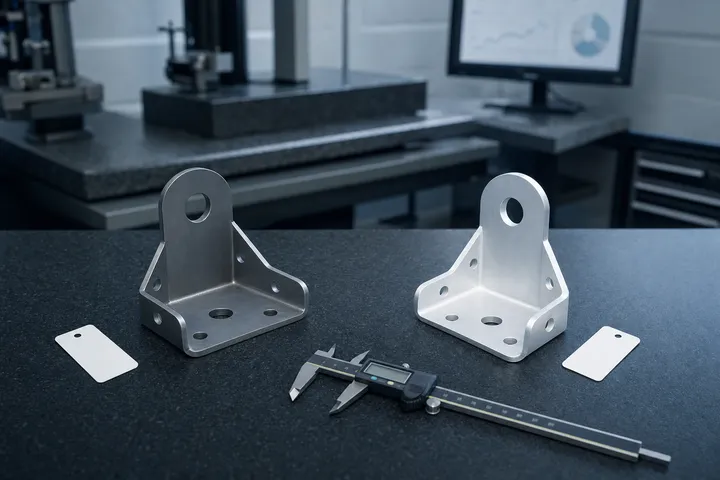
A steel and an aluminium version of the same sheet-metal bracket side by side on an inspection bench D

Design

A different material or less weight — priced before anything is released.

What changes Material and weight

Example Steel at 2.12 €/kg and 13.6 kg against aluminium at 4.35 €/kg and 4.7 kg — on material alone, the aluminium version is cheaper.

How we calculate it

A fiber laser cutting head at work with an idle mechanical shear behind it A

Automate

The process and machine that fit the part — not the most expensive one available.

What changes Process route and machine-hour rate

Example Fiber laser at 38.10 €/h and 5,000 mm/min against a mechanical shear at 13.00 €/h and 7,000 mm/min.

How we calculate it
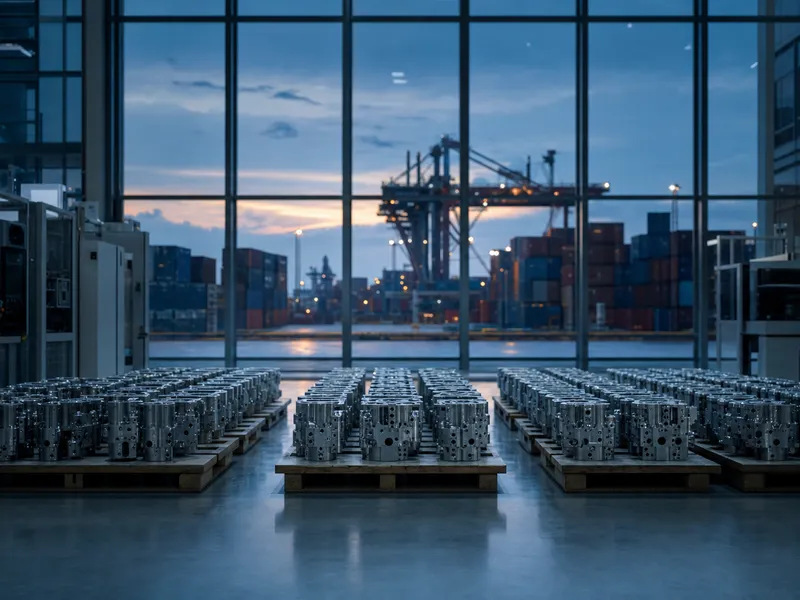
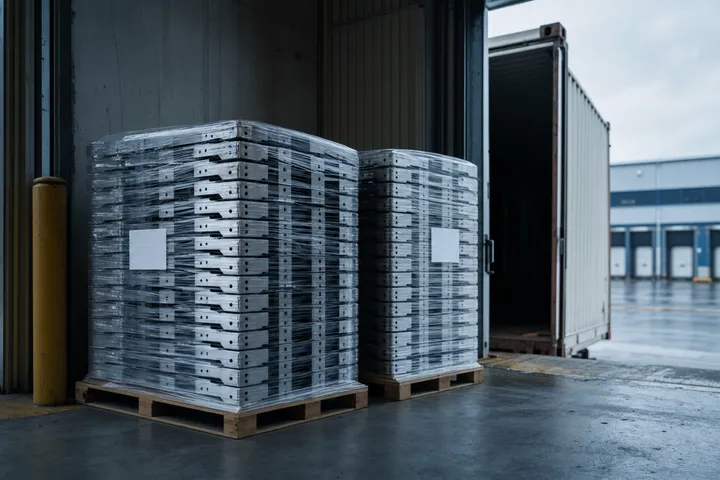
Two identical pallets of parts staged for shipment next to a container R

Re-locate

What the same part costs in another country — as a calculation, not a guess.

What changes Labour, energy and overhead per country

Example Labour rate 32 €/h in Germany · 12 €/h Poland · 8 €/h China · 28 €/h United States.

How we calculate it
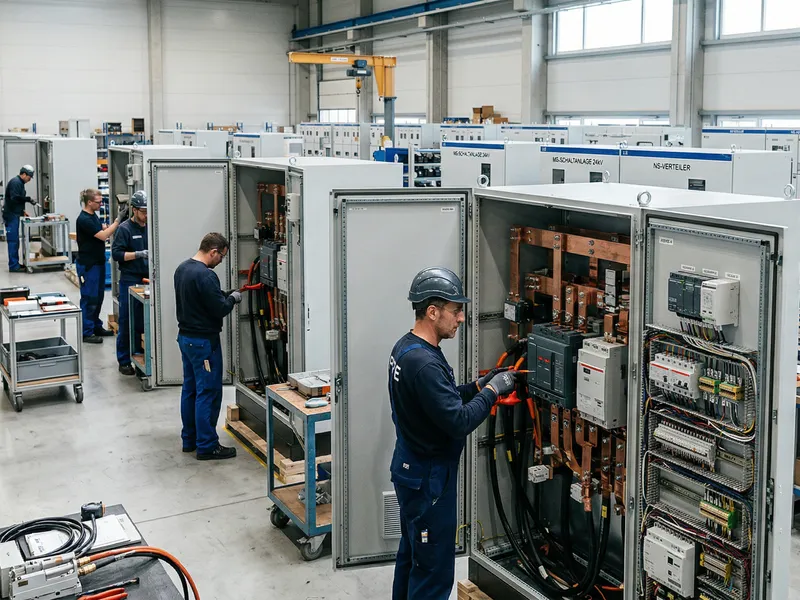
A visitor with a tablet walking a supplier’s machine shop I

Identify

Which supplier actually manufactures the part cheaply — and which one only prices it that way.

What changes The individual plant’s rates instead of a country average

Example The real machine and labour rates of the supplying plant replace the flat country assumption.

How we calculate it
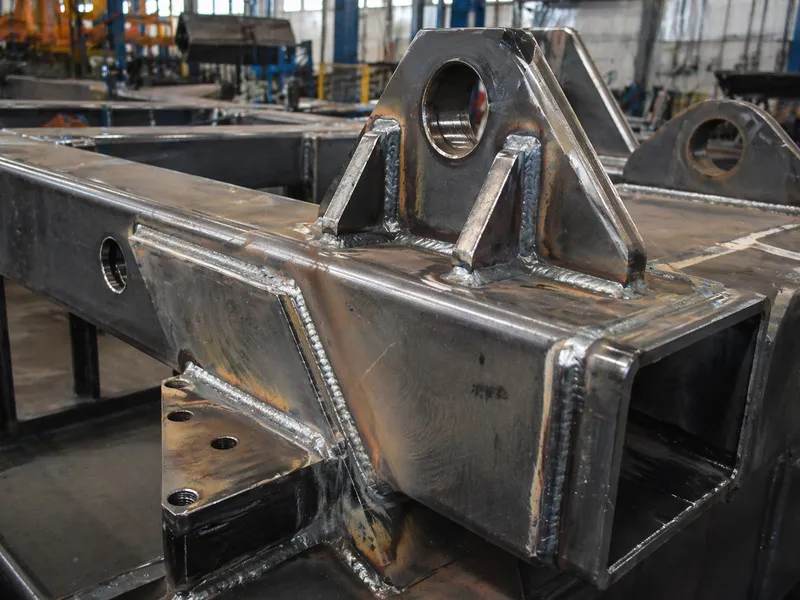
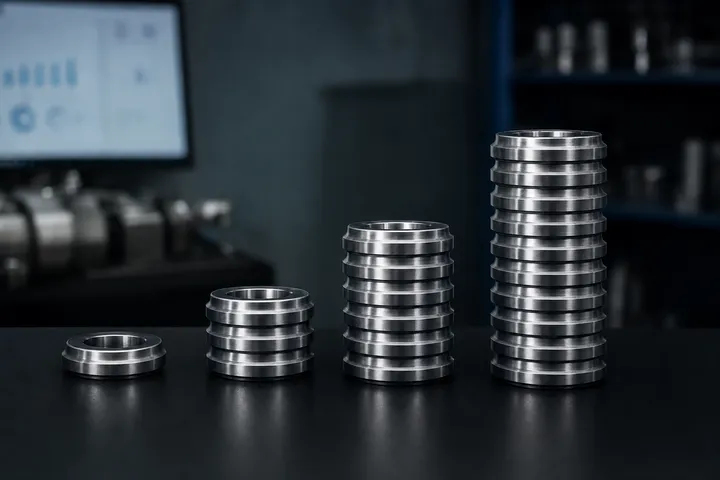
Stacks of identical turned parts in increasing batch sizes N

Negotiate

Bundle quantities, spread setup cost — the lever that costs nothing in quality or delivery.

What changes Order quantity and setup-cost allocation

Example Setup time is spread across more pieces, so the piece price falls without touching the part itself.

How we calculate it

Example values from the FTE-0001 sheet-metal part in the DARIN calculator. An example, not a commitment. Average savings potential identified in COVALYZE Fast Track and platform engagements since 2019. Identified potential is not the same as realised savings — actual results vary by commodity, supplier base, quantity structure and data quality.

What you receive

A number you can defend, with everything behind it.

The point is not a single figure in a slide. You get the breakdown, the assumptions, the scenarios per lever and a priority list — so your team can check the calculation, argue with it, and use it.

Inside a DARIN deliverable 10 deliverables
01 Current-cost baseline per part
02 Should-cost breakdown: material, machine, labour, setup, overhead
03 Five-lever scenario matrix
04 Assumptions and data sources, per input
05 Confidence assessment and open questions
06 Savings potential per part and per lever
07 Implementation effort per measure
08 Recommended priorities
09 Negotiation package: target price, gap per supplier, cost-driver evidence
10 Export to Excel or PDF, or continuous access in COVALYZE Analytics
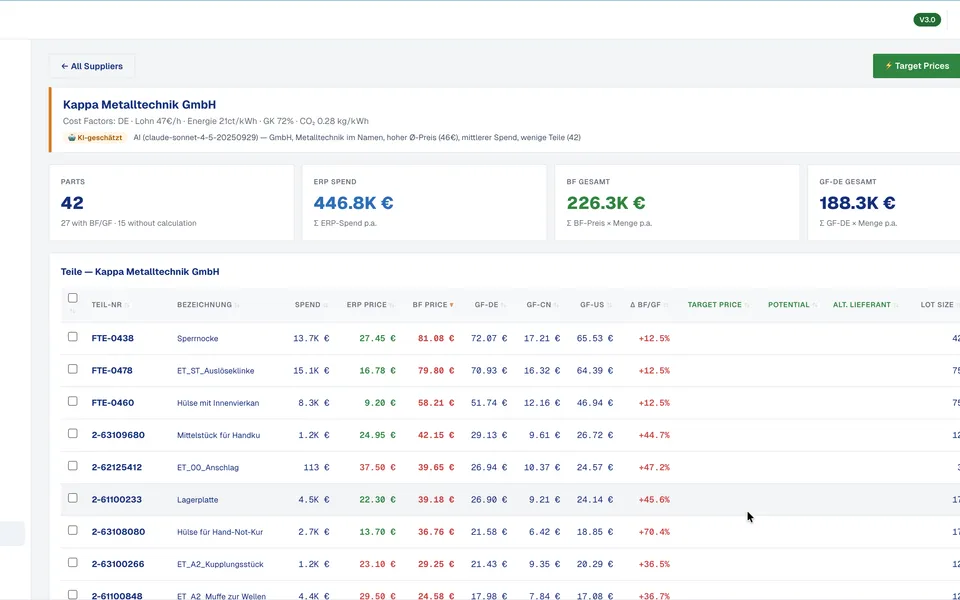
Negotiation brief: paid price against should-cost, per part
DARIN negotiation brief listing paid price, should-cost per country, target price and savings potential per part
Example calculation

One part, five levers, one calculation.

FTE-0001 is a laser-cut and bent sheet-metal bracket: cut, bent, deburred and coated. Below is what the calculation compares for each lever — and what it does to the piece price. Every value is an example from the DARIN calculator, not a commitment.

Cut length 3,700 mm outline plus holes
Feed rate 5,000 mm/min Fiber laser, from the machine record
Laser time 0.74 min Calculated from the drawing, not estimated
Piece price example 41 € DE · 28 € PL Same part, two production countries
FTE-0001 · sheet-metal bracket · process chain: Cut · Bend · Deburr · Coat Example
LeverBaselineAlternativeEffect on the piece price
Design Material and weight Steel · 2.12 €/kg · 13.6 kg Aluminium · 4.35 €/kg · 4.7 kg On material alone the aluminium version comes out lower: two thirds less weight outweighs the higher price per kilo.
Automate Cutting process and machine rate Fiber laser · 38.10 €/h · 5,000 mm/min Mechanical shear · 13.00 €/h · 7,000 mm/min A few euros on this part. Cutting is a small share of a price that is dominated by material — so this is not where the effort belongs here.
Re-locate Country cost structure Germany · labour 32 €/h Poland · labour 12 €/h 41 € in Germany against 28 € in Poland — a double-digit percentage on this part.
Identify Whose rates the calculation uses Country-average machine and labour rates The actual rates of the supplying plant Shows whether a price reflects what that plant's cost structure implies — or something above it.
Negotiate Order quantity and setup allocation Current order quantity Quantity bundled across sites and periods The strongest lever on this part, and the one that costs nothing in quality or delivery reliability. Setup time simply spreads across more pieces.

Example values from the FTE-0001 sheet-metal part in the DARIN calculator. An example, not a commitment. Average savings potential identified in COVALYZE Fast Track and platform engagements since 2019. Identified potential is not the same as realised savings — actual results vary by commodity, supplier base, quantity structure and data quality.

In the platform

A map of where the money is, and a number per part.

Two views from the DARIN application: the spend portfolio grouped into similar-part clusters, and the same part costed for several production countries down to energy and CO₂. One tells you where to look, the other what to do about it.

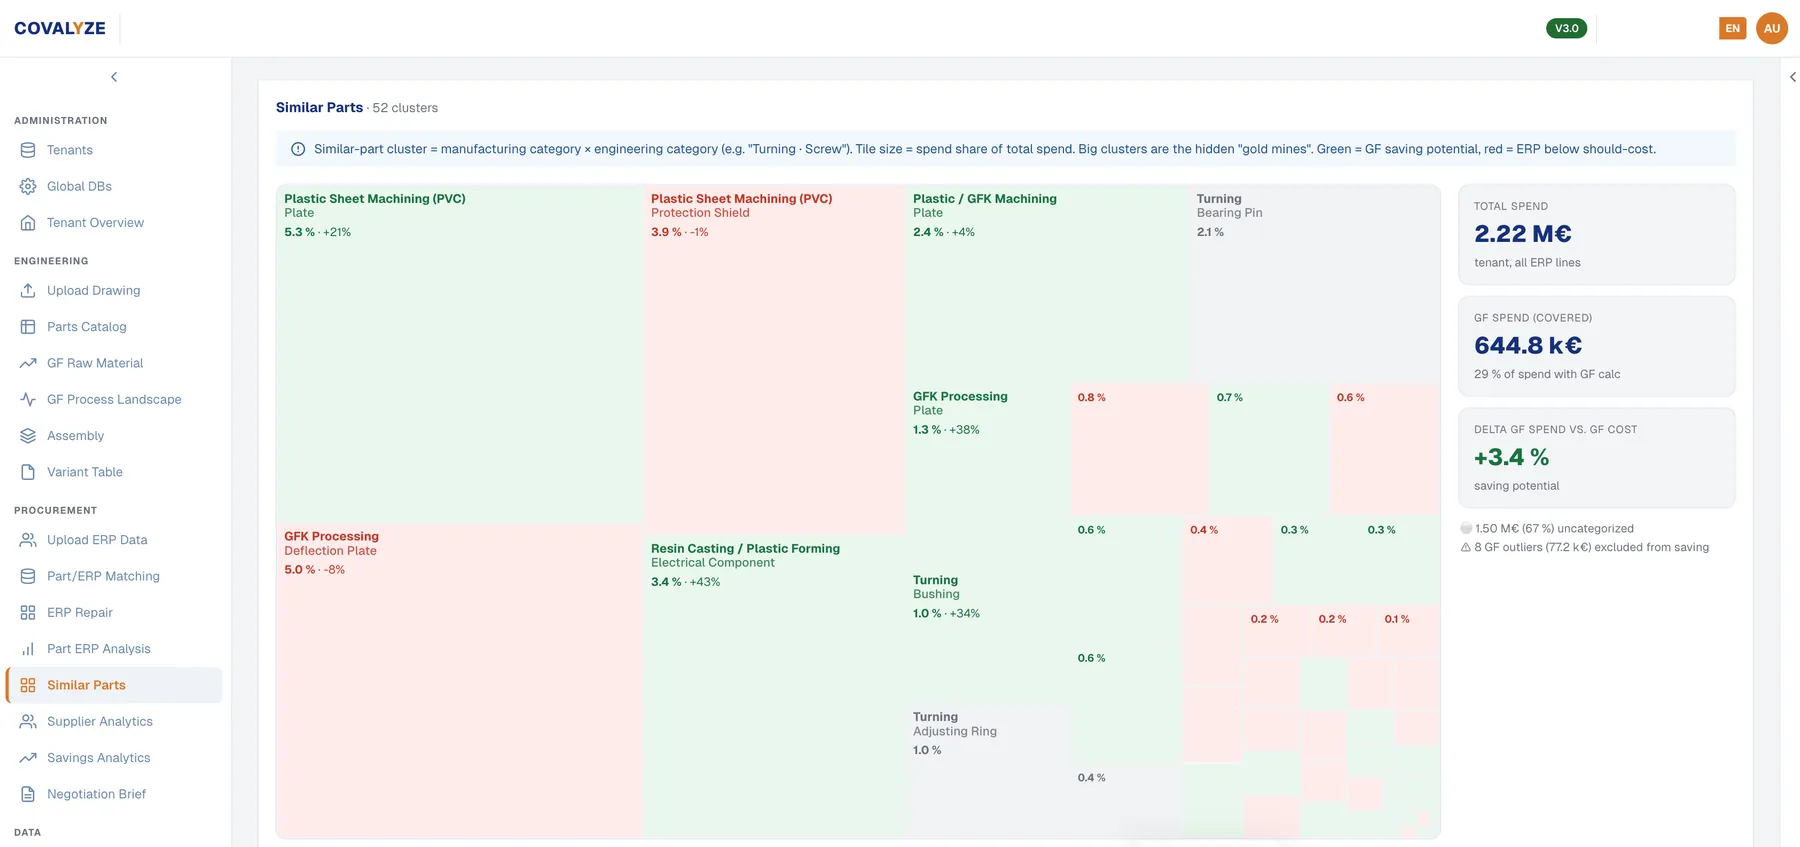
Similar-part clusters Product view
DARIN similar-part cluster map sized by spend share, colored by savings potential against should-cost
Each tile is a cluster of technically comparable parts, sized by its share of spend. Green means the paid price sits above the should-cost; red means below it.
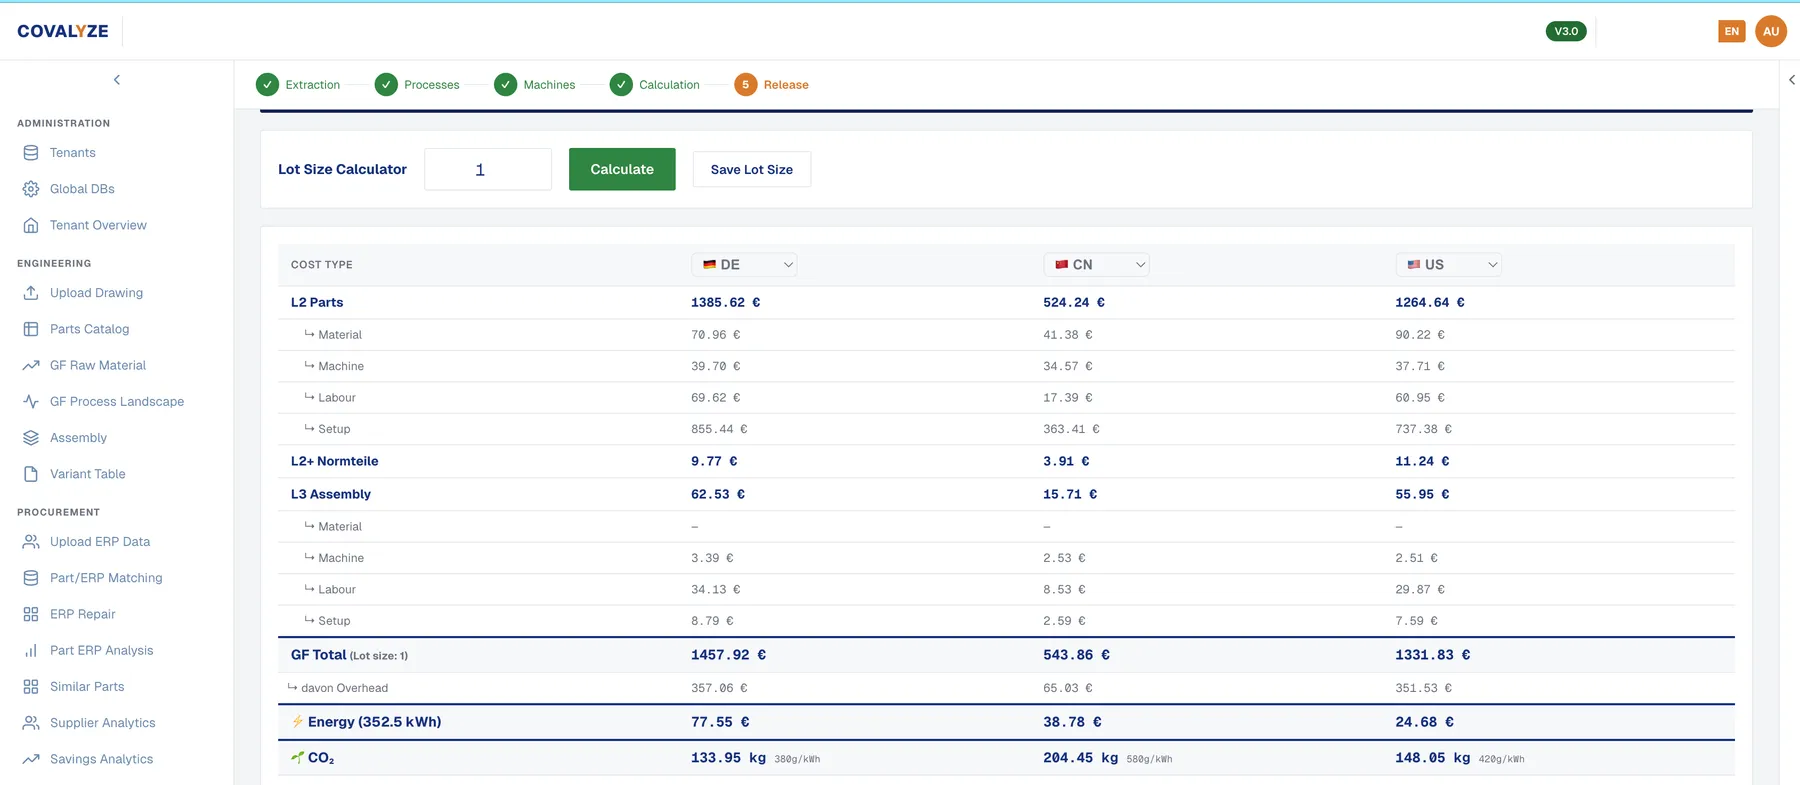
Cost and CO₂ by region Product view
DARIN cost table comparing material, machine, labour, setup, overhead, energy and CO2 for Germany, China and the United States
The full cost stack per production country, including the overhead contained in the total, the energy in kWh and the resulting CO₂ from that country's grid.

Screenshots from a demonstration tenant. Figures depend on the parts, quantities and rates in your own data.

Trusted by Industry Leaders
Procurement, cost engineering and design teams at leading manufacturers work with COVALYZE

Continental logo
Deutsche Bahn logo
Dyson logo
Daimler Truck logo
Knorr Bremse logo
EFESO Management Consulting logo
MUVIQ logo
Aurelius logo
Siemens logo
Schleuniger logo
TI Automotive logo
United Grinding logo

Quantity as the dominant cost driver in the energy-sector case, design parameters in the forklift-carriage case, country and process scenarios in the private-equity case. Average savings potential identified in COVALYZE Fast Track and platform engagements since 2019. Identified potential is not the same as realised savings — actual results vary by commodity, supplier base, quantity structure and data quality.

How long it takes

A calculation, not a project.

One part is a calculation. A whole commodity group is a two-week Fast Track. We keep those two promises separate on purpose.

  1. 01 One documented part, known process

    First calculation within one business day

    Sheet metal, turned and milled parts, coating: these process models are already in place, so the calculation starts from your drawing.

  2. 02 New or unusual manufacturing process

    Model setup and review required

    We set up the process with times, machine rates and setup logic — typically one additional day. It then stays available, so the next part of that type is a calculation again.

  3. 03 Commodity group, up to 200 parts

    Results in approximately two weeks

    Drawing extraction, data preparation and a results walkthrough for a whole commodity group — this is the fixed-scope Fast Track.

Scope

What DARIN does — and what it does not.

Being explicit about the edges makes the number more useful, not less. DARIN quantifies potential and prepares the evidence; the decisions, approvals and supplier agreements stay yours.

COVALYZE specialists reviewing a cost calculation with a customer team
20-minute scoping call
Not sure a part is documented well enough? We'll tell you.
Talk to a specialist
DARIN does
Calculate transparent, part-level cost scenarios
Identify and quantify the likely cost-reduction levers
Prioritize parts, measures and effort
Prepare target prices and the evidence behind them
DARIN does not automatically
Approve engineering changes
Guarantee that a supplier accepts a target price
Certify or validate an alternative design
Qualify new suppliers without a separate engagement
Guarantee realised savings
Engagement options

Three ways to use DARIN.

Start with one part, buy a commodity group as a fixed-scope project, or run the method continuously in your own team.

Start here

Part Check

One part · known process · one business day

On request

Send one drawing with its current price and quantities. You get the should-cost breakdown for that part, the levers that apply to it, and a target price you can put in front of a supplier.

  • One part, calculated end to end
  • Cost breakdown with every assumption visible
  • Applicable levers named and quantified
  • Walkthrough of the result with a specialist
Submit a part
Most chosen

Commodity Fast Track

One commodity group · up to 200 parts · two weeks

19.500 € Fixed fee

The fixed-scope way to buy the DARIN methodology. We extract your drawings, link them to spend data and deliver target prices, savings potential and negotiation evidence for a whole commodity group.

  • Up to 200 parts analyzed
  • Drawing extraction via PartIQ
  • Five-lever scenario matrix per part
  • Negotiation package and results walkthrough
See the Fast Track
Ongoing

Continuous capability

All commodities · platform access · ongoing

Custom

DARIN inside COVALYZE Analytics, used by your own team. Cost models stay live, new drawings flow in through PartIQ, and engineering, procurement and plants work from the same numbers.

  • Unlimited parts and categories
  • Target price calculator for new designs
  • Unlimited named users per category
  • Dedicated onboarding and support
Explore Analytics

Fast Track pricing as published on the offer page. Part Check scope is agreed in the scoping call.

DARIN — frequently asked questions.

DARIN in context

DARIN is COVALYZE’s structured cost-optimization methodology. It combines automated technical-data extraction, should-cost calculation and scenario analysis to identify and quantify five cost levers for manufactured parts. You can use it through a managed assessment, a Fast Track commodity project, or continuously inside COVALYZE Analytics. The five letters are the five levers: Design, Automate, Re-locate, Identify, Negotiate.

Data, time and limits

Minimum input: technical drawing, cad model or specification, current purchase price, annual quantity and order quantity, supplier and production country. Bills of materials, routings, material specifications, Incoterms, supplier quotations and any rates you already know all improve the result, but are not required to start. If something is missing we state the assumption we used instead of hiding it.

CTA background

Send us one commodity group. We'll show you the cost, not the price.

We calculate a part or a commodity group from the ground up and show the savings potential per part and per lever — with every assumption on the table.

Analyze a commodity group