DARIN · RE-LOCATE + IDENTIFY
A location change should be a calculation, not a risk.
What the same part costs in four countries, built from its own process chain and each location's labour, energy and overhead structure — and what the supplying plant's real rates say about the price you pay today.
TWO LEVERS, ONE COST MODEL
Same part, same calculation, different location.
41 € against 28 € is a factory-cost comparison. A sourcing decision needs more.
The country calculation is the honest starting point: it tells you whether there is anything worth investigating. What turns it into a decision is the list below — and we will tell you in the scoping call which of these we quantify for your case rather than pretend they are all in the model.
- 01
Freight and packaging
Distance, mode, part density and packaging requirements can consume a large share of a labour-cost advantage — especially on heavy or bulky parts, where a container of air is expensive.
- 02
Duties, tariffs and origin rules
Duty rates and rules of origin change what the same part costs at your gate, and they change faster than a cost model does. This is a live input, not a constant.
- 03
Inventory and working capital
Longer transit means more stock in the pipeline and larger safety stock. That is real capital cost, and it belongs on the same page as the piece price.
- 04
Minimum order quantities and lot sizes
A lower piece price at a minimum order of 5,000 is not a lower cost if you need 800 a year. Quantity and location interact — which is why the two levers are calculated together.
- 05
Lead time and flexibility
Six weeks of transit removes options you currently have for free: reacting to a demand change, correcting a defect batch, pulling a delivery forward.
- 06
Quality cost and qualification
Sampling, first-article inspection, audits, travel, and the cost of the learning curve at a new plant. These are one-time costs that a piece-price comparison ignores.
- 07
Tool transfer and ownership
If the tool is at the current supplier, moving it — or building a new one — is a large part of the business case. Who owns it decides whether relocation is even practical.
- 08
Currency, energy and risk exposure
Exchange-rate movement, regional energy prices, capacity, export controls and geopolitical risk all sit in the decision. Some can be modelled, some can only be named — and naming them beats leaving them out.
The same process chain, priced in each country.
Re-locate does not apply a country factor to a finished price. The part's own process chain is recalculated with the labour, energy and overhead structure of the location in question — so the comparison is between two calculations, not between a price and an assumption.
One part, two locations.
FTE-0001 is a laser-cut and bent sheet-metal bracket — the same example part used throughout the DARIN pages. Below is what changes between two production countries, and what does not.
| Input | Germany | Poland | What it does |
|---|---|---|---|
| Re-locate Labour rate per hour | 32 €/h | 12 €/h | Applies to the labour time the part actually needs. On a part with little manual content the effect is small; on a labour-intensive one it dominates. |
| Re-locate Energy and overhead factor | German factor | Polish factor | Carried by the process cost, not the material — so it scales with machine and labour time, not with part weight. |
| Re-locate Material cost | 2.12 €/kg · 13.6 kg | Broadly the same | Steel is a traded commodity. Where material dominates the part cost, relocation is the wrong lever and the calculation says so. |
| Identify Whose rates are used | Country-average rates | The named plant's actual rates | Turns a theoretical country comparison into a statement about a specific supplier: is this price what that plant's cost structure implies, or more? |
Example values from the FTE-0001 sheet-metal part in the DARIN calculator. An example, not a commitment. Average savings potential identified in COVALYZE Fast Track and platform engagements since 2019. Identified potential is not the same as realised savings — actual results vary by commodity, supplier base, quantity structure and data quality.
What the same part costs in each region — down to energy and CO₂.
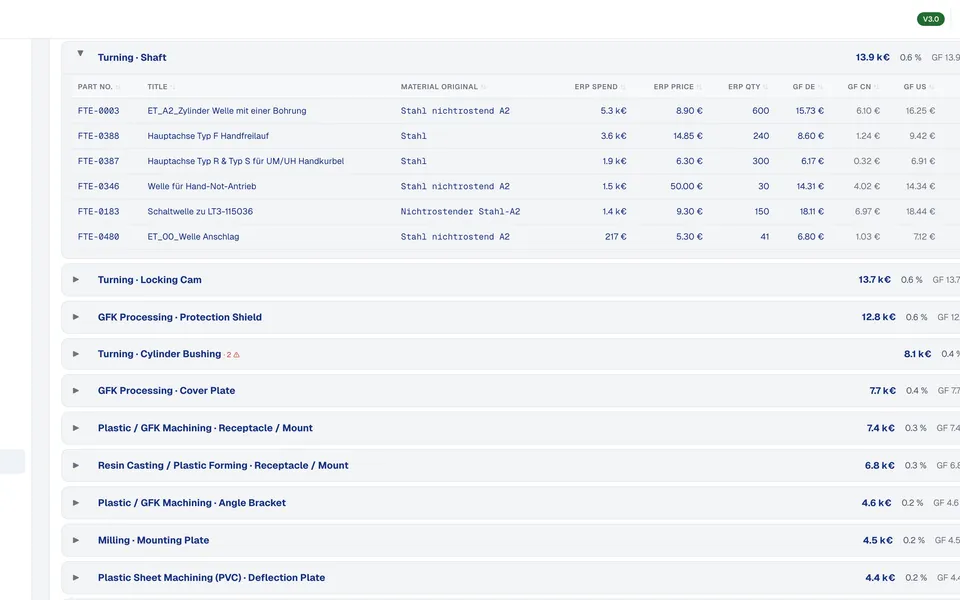
The cost stack is recalculated per production country: material, machine, labour and setup, the overhead contained in the total, the energy the part consumes in kWh, and the CO₂ that follows from the local grid intensity. Beside it, the supplier view breaks the covered spend into machine capital, energy and labour — the three drivers that actually explain why another region is cheaper.
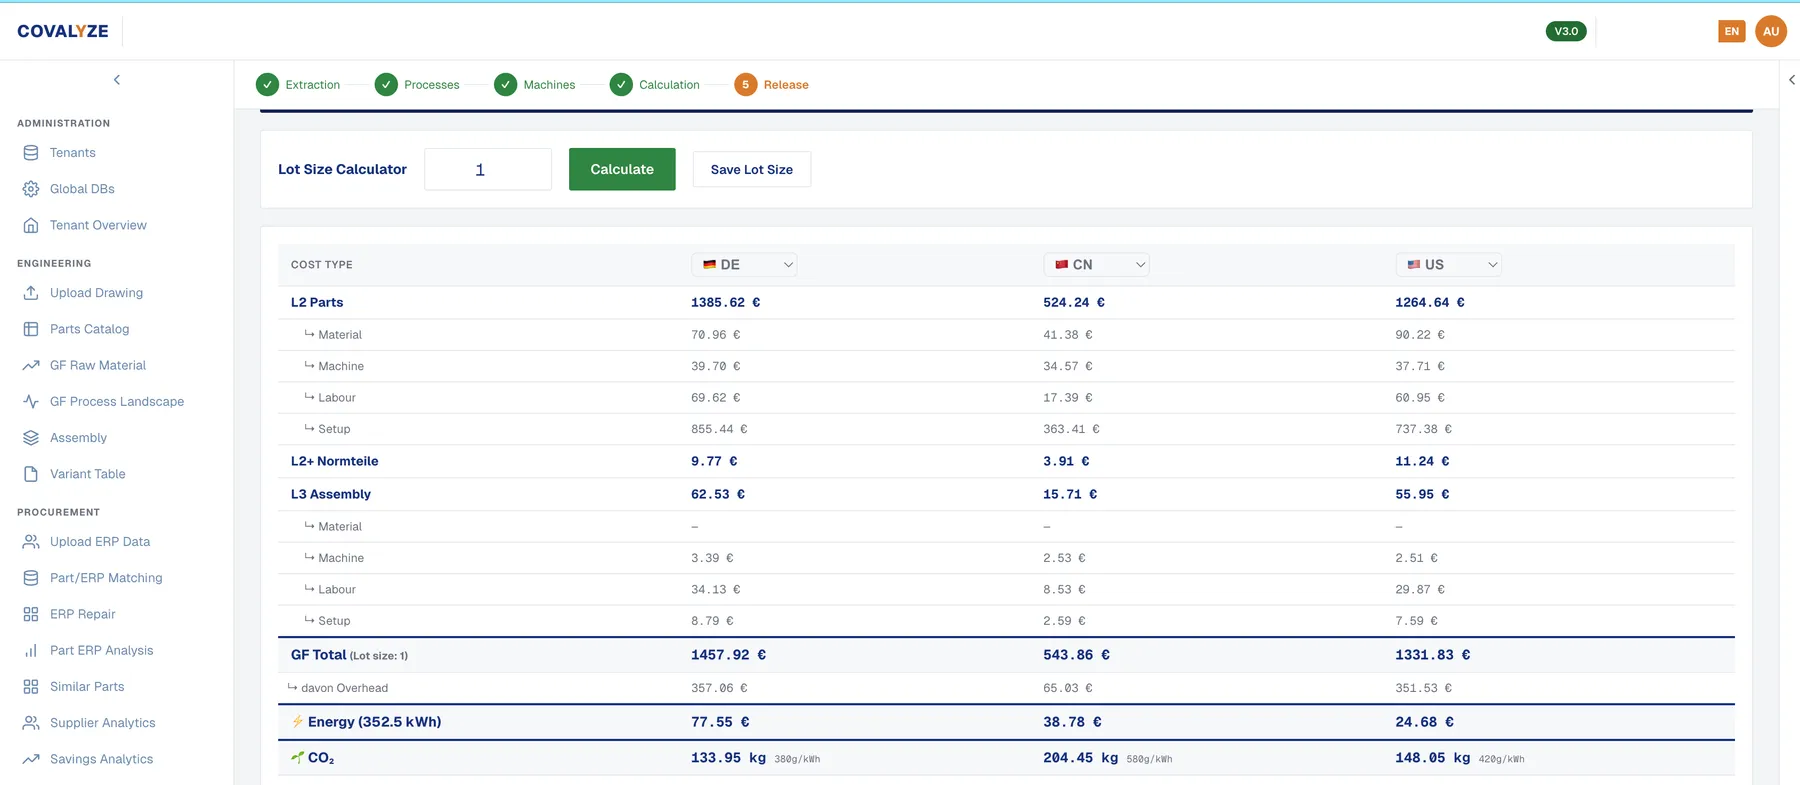
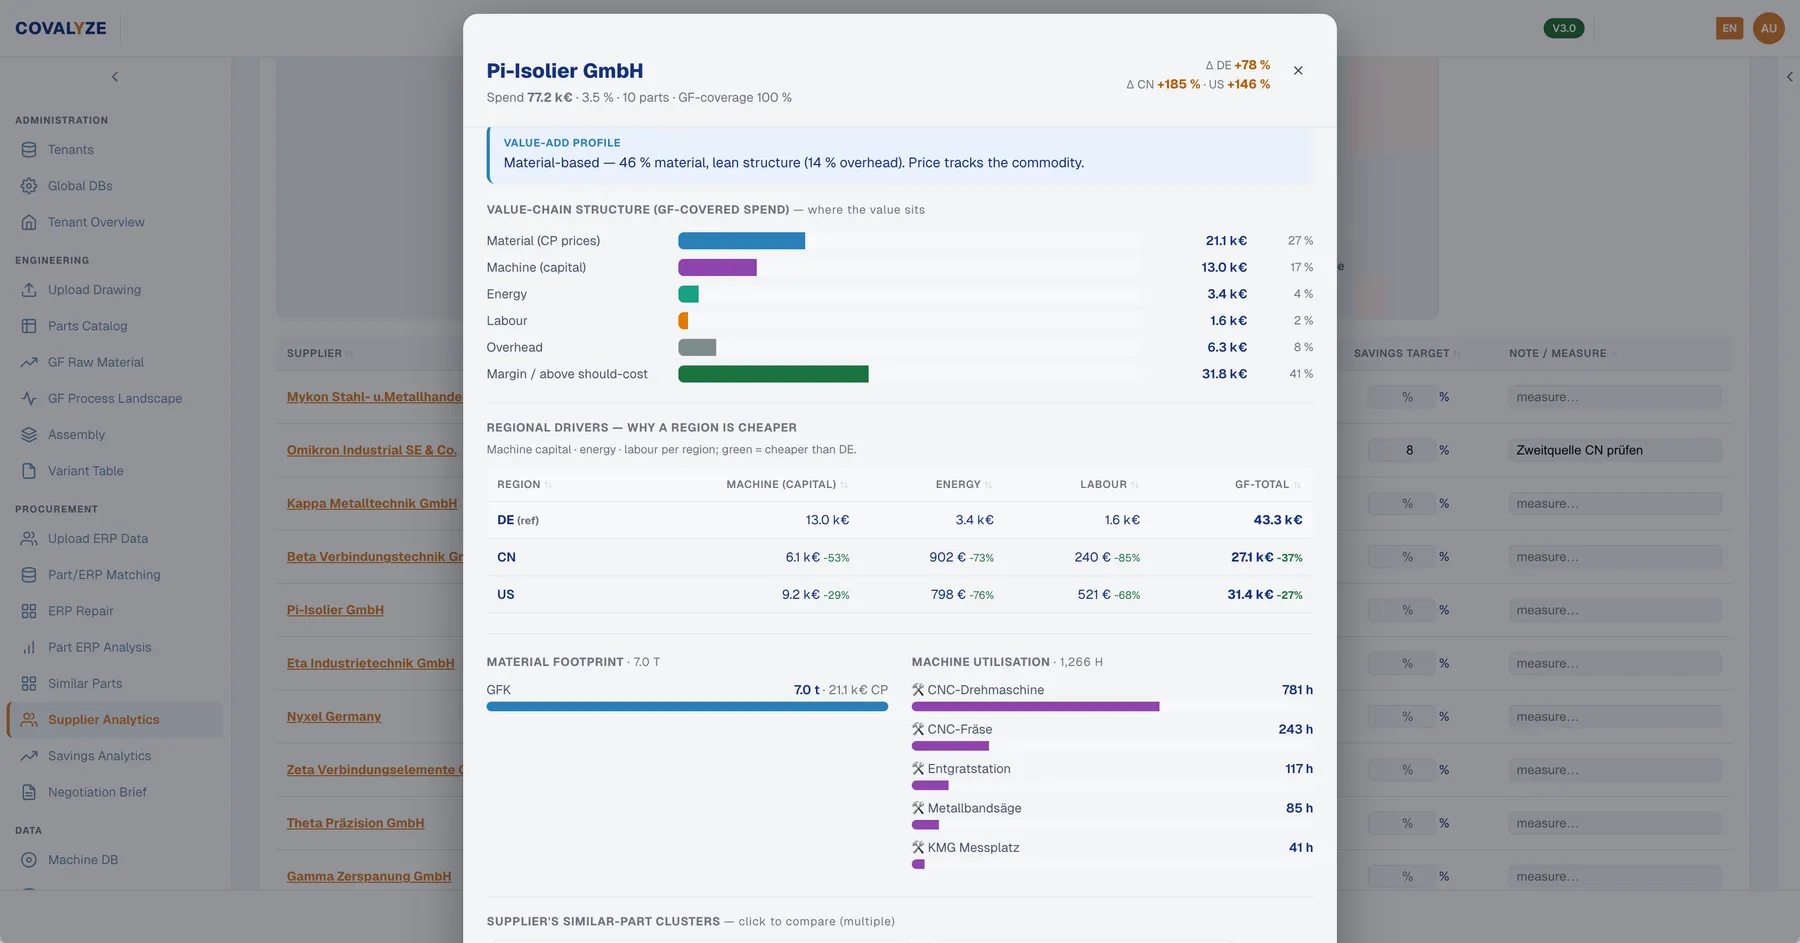
Screenshots from a demonstration tenant; supplier names are pseudonymised. These are factory-cost figures plus energy and CO₂ — freight, duties, inventory and qualification are the decision frame described above, scoped per engagement.
Identify means the plant's real cost structure — not a supplier search.
The lever exists because a country average says little about the supplier in front of you. Two plants in the same country, with different machines and utilisation, produce genuinely different costs. Here is what that does and does not include.
A location comparison needs more than a drawing.
For a sourcing question the commercial context matters as much as the geometry. Missing items do not block the analysis — they become stated assumptions instead, and we flag which ones would change the answer.
Client result · private equity portfolio company
Germany, Romania, Poland, China — on one costing logic.
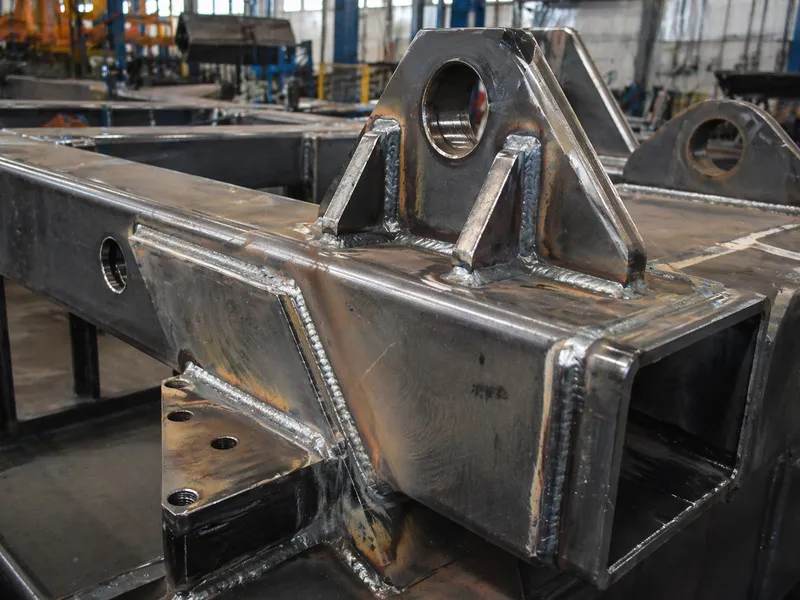
A 44-component welded assembly weighing 40 kg was costed live during an investor meeting, producing a structured should-cost above EUR 1,600 within seconds and 200–250+ parameters straight from the 3D model. The same cost logic was then used to compare regional production scenarios across four countries — the point being that a location question is answered with the part's own calculation rather than with a separate spreadsheet exercise.
In the turned-parts category the neighbouring lever mattered more: 50 high-runner parts were spread across more than 10 suppliers, and fragmentation — not location — was the finding. Which lever wins is an output of the analysis.
Where location and supplier structure decided the cost.
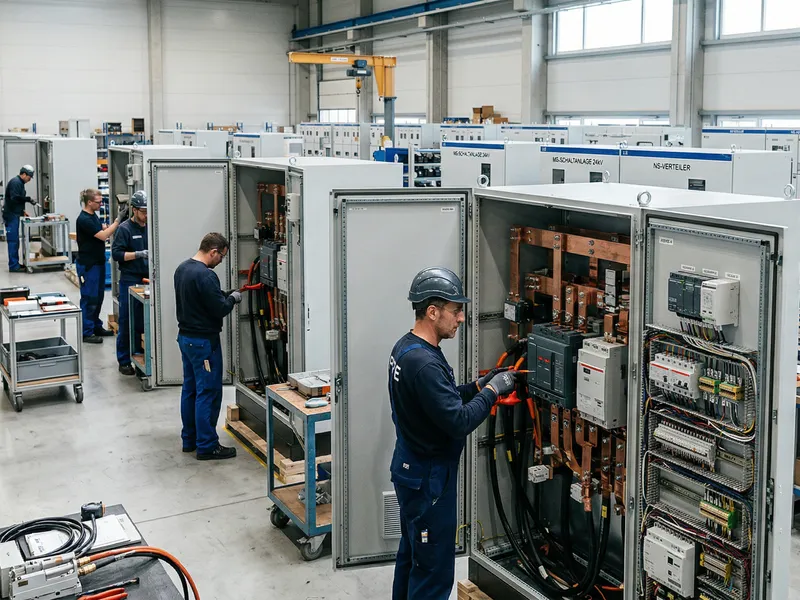
A few more client results from the case library, each driven by the same markdown-based format.

Average savings potential identified in COVALYZE Fast Track and platform engagements since 2019. Identified potential is not the same as realised savings — actual results vary by commodity, supplier base, quantity structure and data quality.
Re-locate and Identify are two of five.
A location scenario is rarely the whole answer — quantity structure and design decisions usually move the same part too.
- D Design Material and weight
- A Automate Process route and machine-hour rate
- R Re-locate Labour, energy and overhead per country You are here
- I Identify The individual plant’s rates instead of a country average You are here
- N Negotiate Order quantity and setup-cost allocation
Global sourcing cost analysis — frequently asked questions.
Scope of the calculation
Implementation

Turn the location question into a calculation.
Send one part with its supplier, plant, prices and quantities. You get the factory cost per location, the plant-rate comparison, and a clear statement of which landed-cost elements we quantified and which remain open.