DARIN · SHOULD-COST METHOD

No markup on the old price. A calculation from the bottom up.

Material, machine, labour, setup time — every value open. This is the method behind every DARIN number, worked through on a real sheet-metal part.

AN OPEN COST MODEL

Every value has a source you can check.

>95% Drawing extraction accuracy (PartIQ)
4 Steps Drawing → process chain → cost → levers
Per Step Time, machine rate, labour, setup share
1 Day First calculation for one documented part
Getting a part in

Five ways a part enters the model.

A 3D model, a 2D drawing, both together, a structured file — or no drawing at all, when you only need a target cost for something that does not exist yet. The staged cascade behind it runs upload, classification, extraction, a completeness gate, then process, machine and cost.

Upload · staged cascade Product view
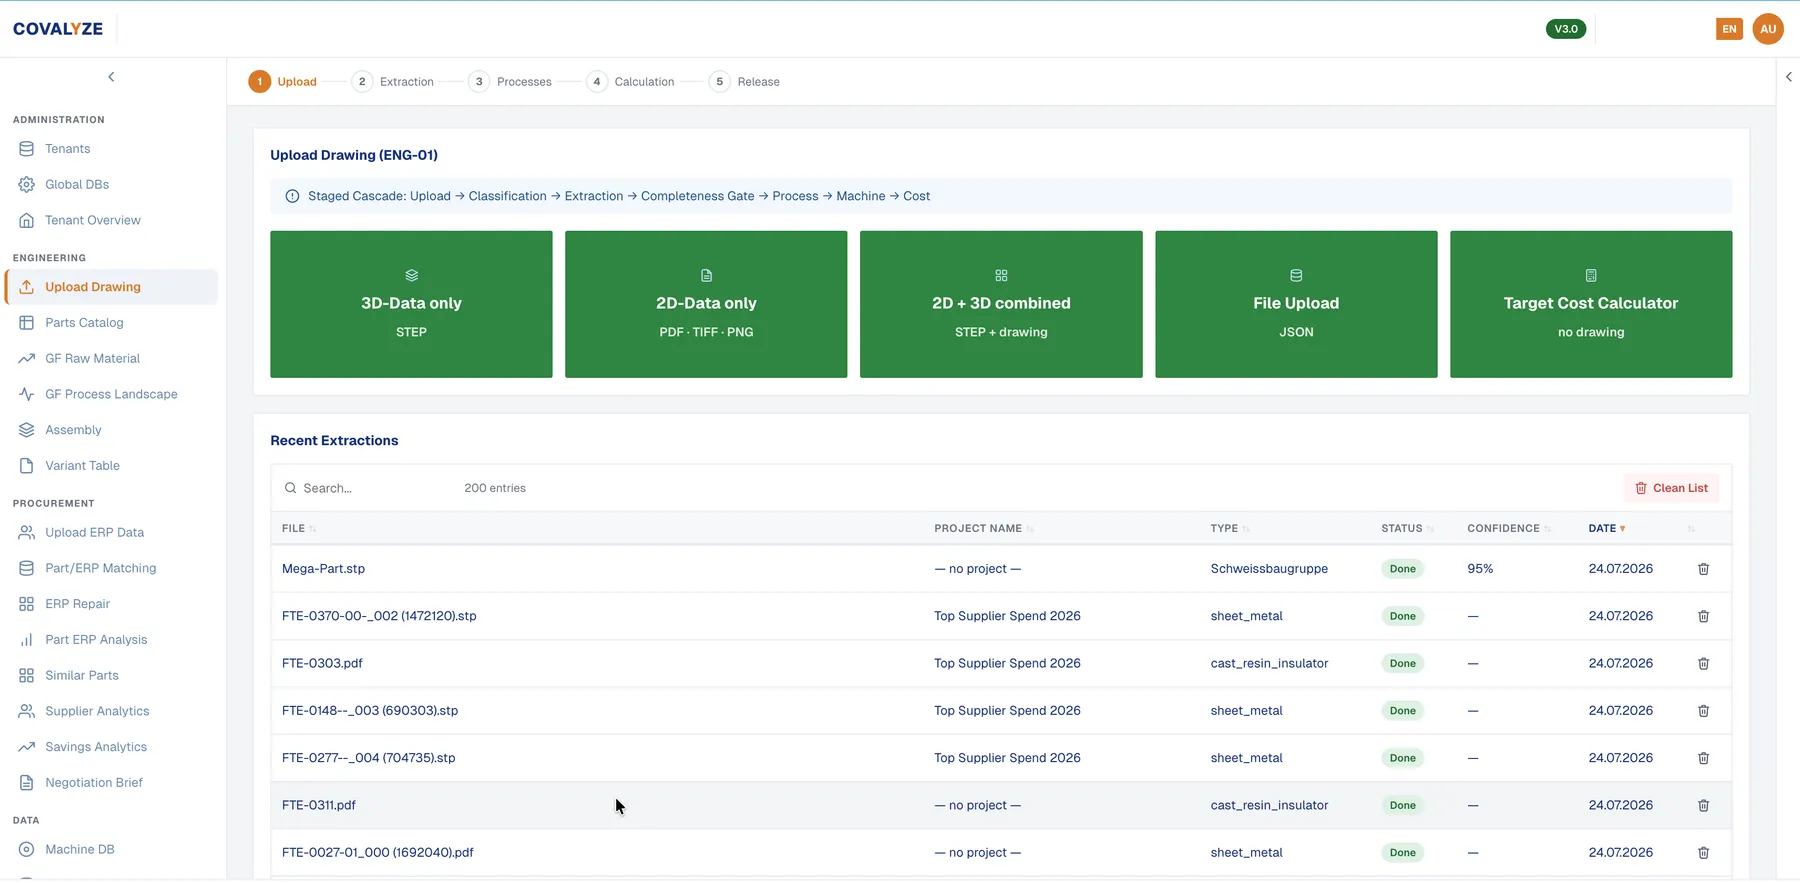
DARIN upload screen with five input paths and a list of recent extractions with confidence values
STEP for 3D, PDF/TIFF/PNG for 2D, both combined, JSON, or the target-cost calculator without a drawing. Recent extractions list their type, status and confidence.
How the calculation works

From a sheet of paper to a calculation.

Four steps, always the same, whether it is one part or a whole commodity group.

01 Read the drawing
02 Build the process chain
03 Cost every step
04 Play the levers
01 Read the drawing

Attributes, Not Pictures

From the 2D PDF, the 3D model or the title block we pull the characteristics that drive cost: material, geometry, sheet thickness, number of bends, holes, surface treatment. This is PartIQ, our extraction system.

Extraction accuracy above 95%, also on full A0 sheets. Every recognised value is shown with where it came from — title block, classification, process detection — and a confidence score, flagged as confident, review or open. Detected process and material are confirmed before anything is calculated.
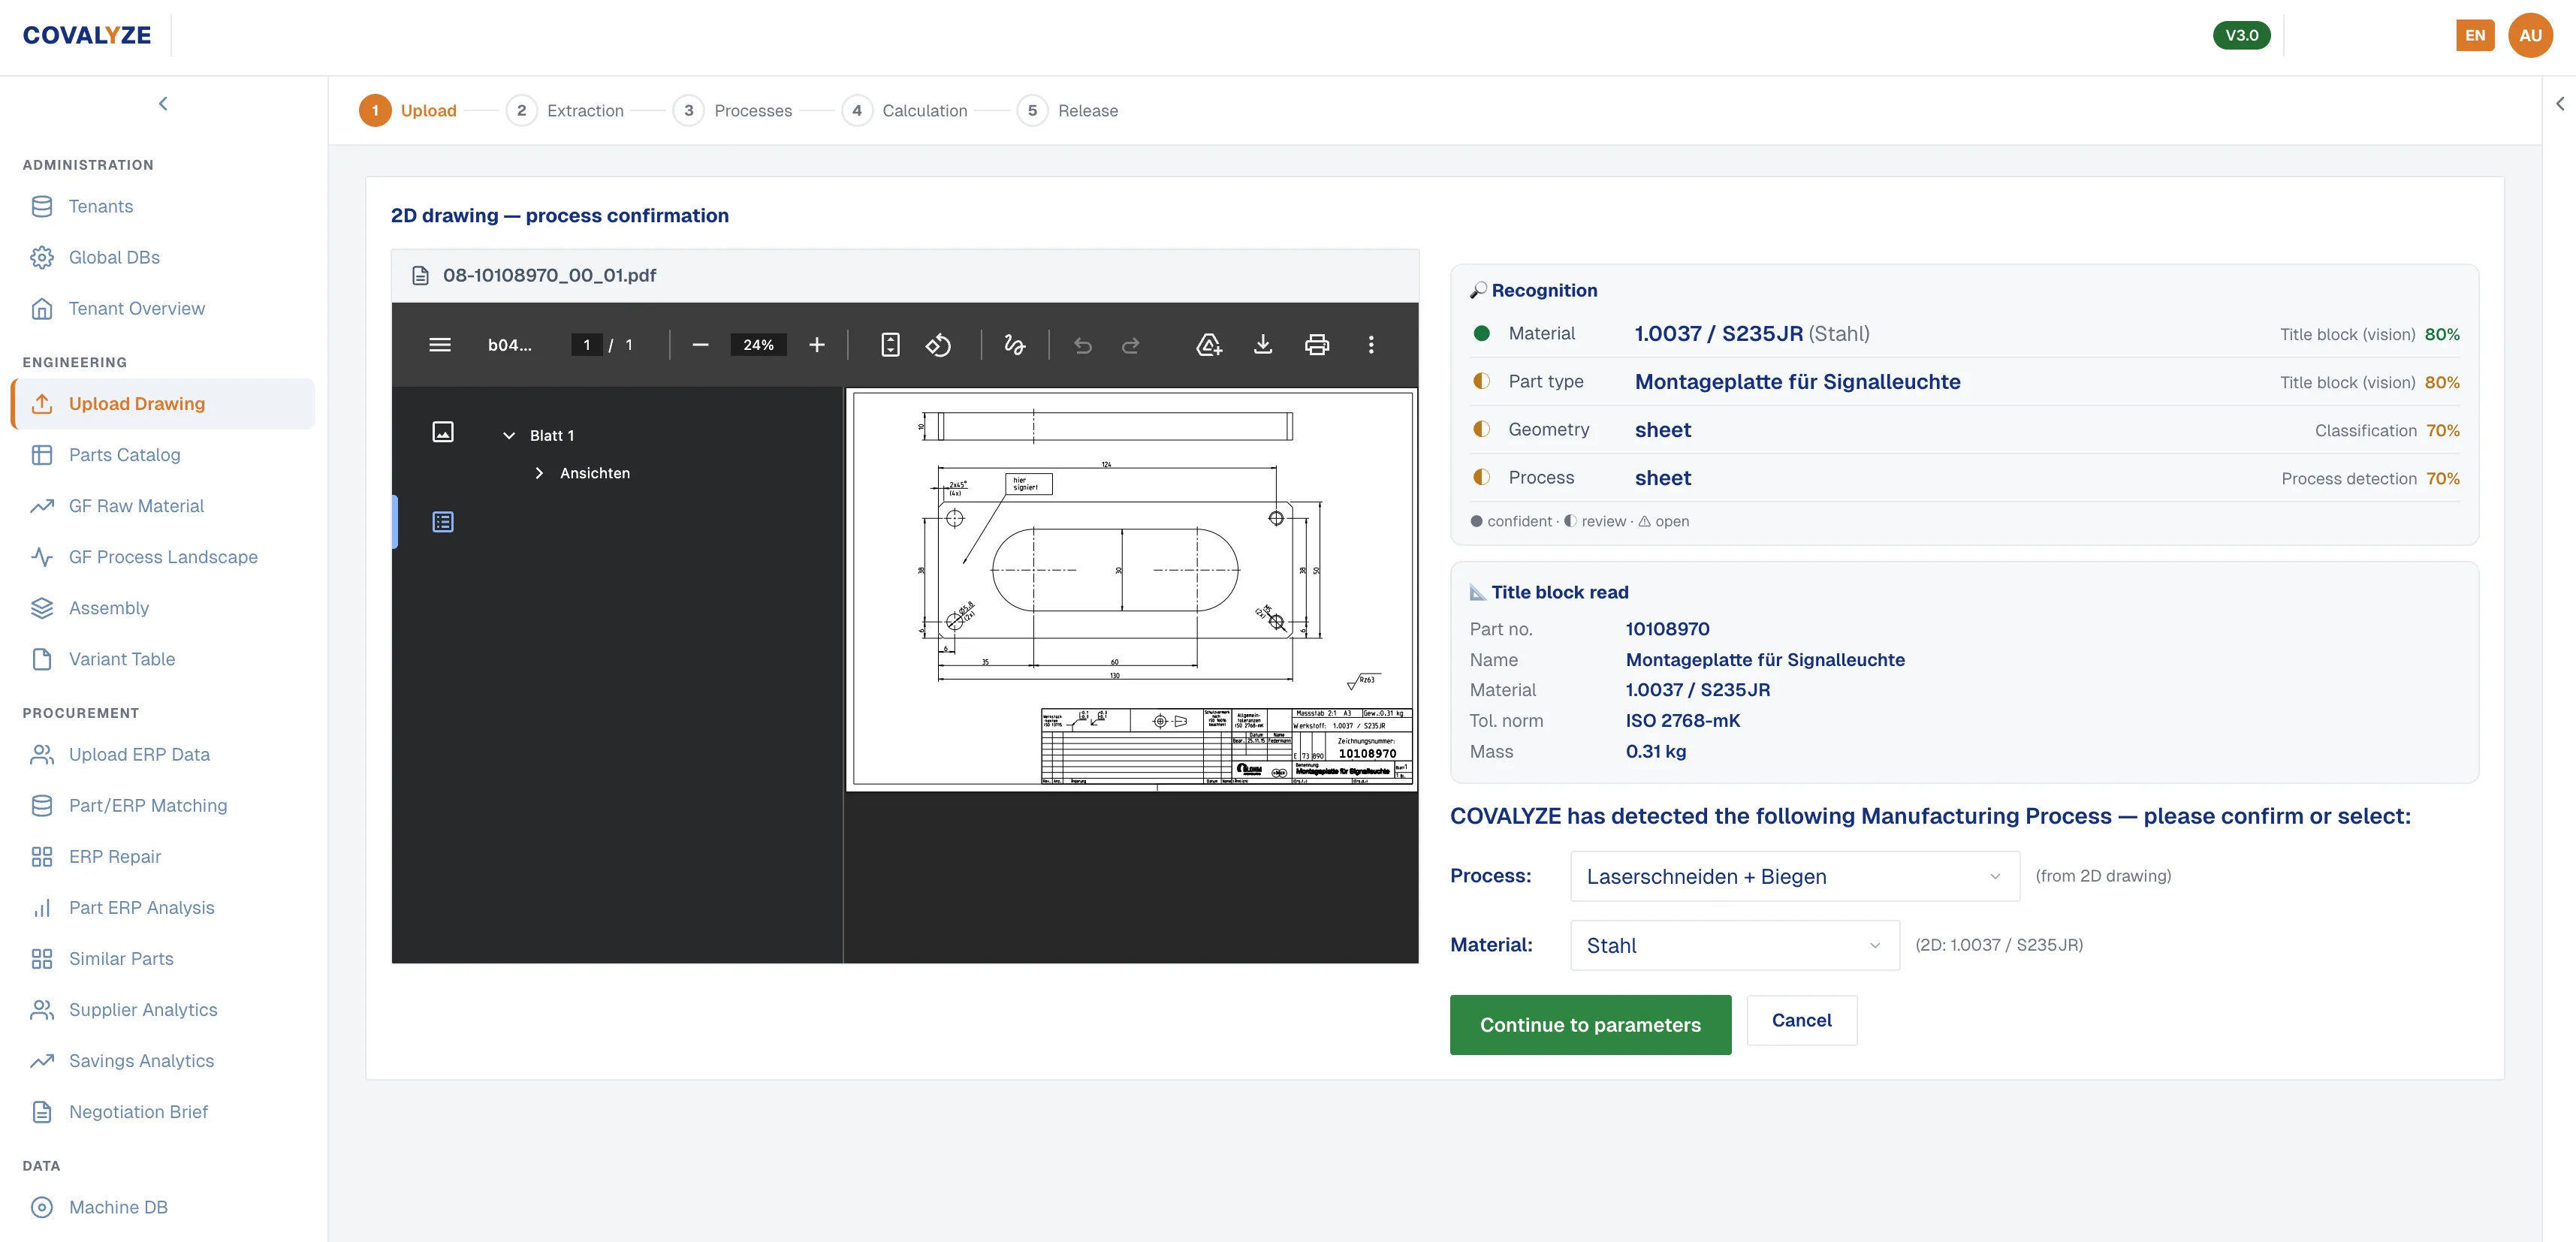
DARIN drawing recognition: the 2D drawing beside the recognised material, part type, geometry and process, each with its source and confidence score
The drawing beside what was read out of it, value by value
02 Build the process chain

Process → Machine → Part

The attributes determine what has to happen to the part. For the FTE-0001 example: cut, bend, deburr, coat.

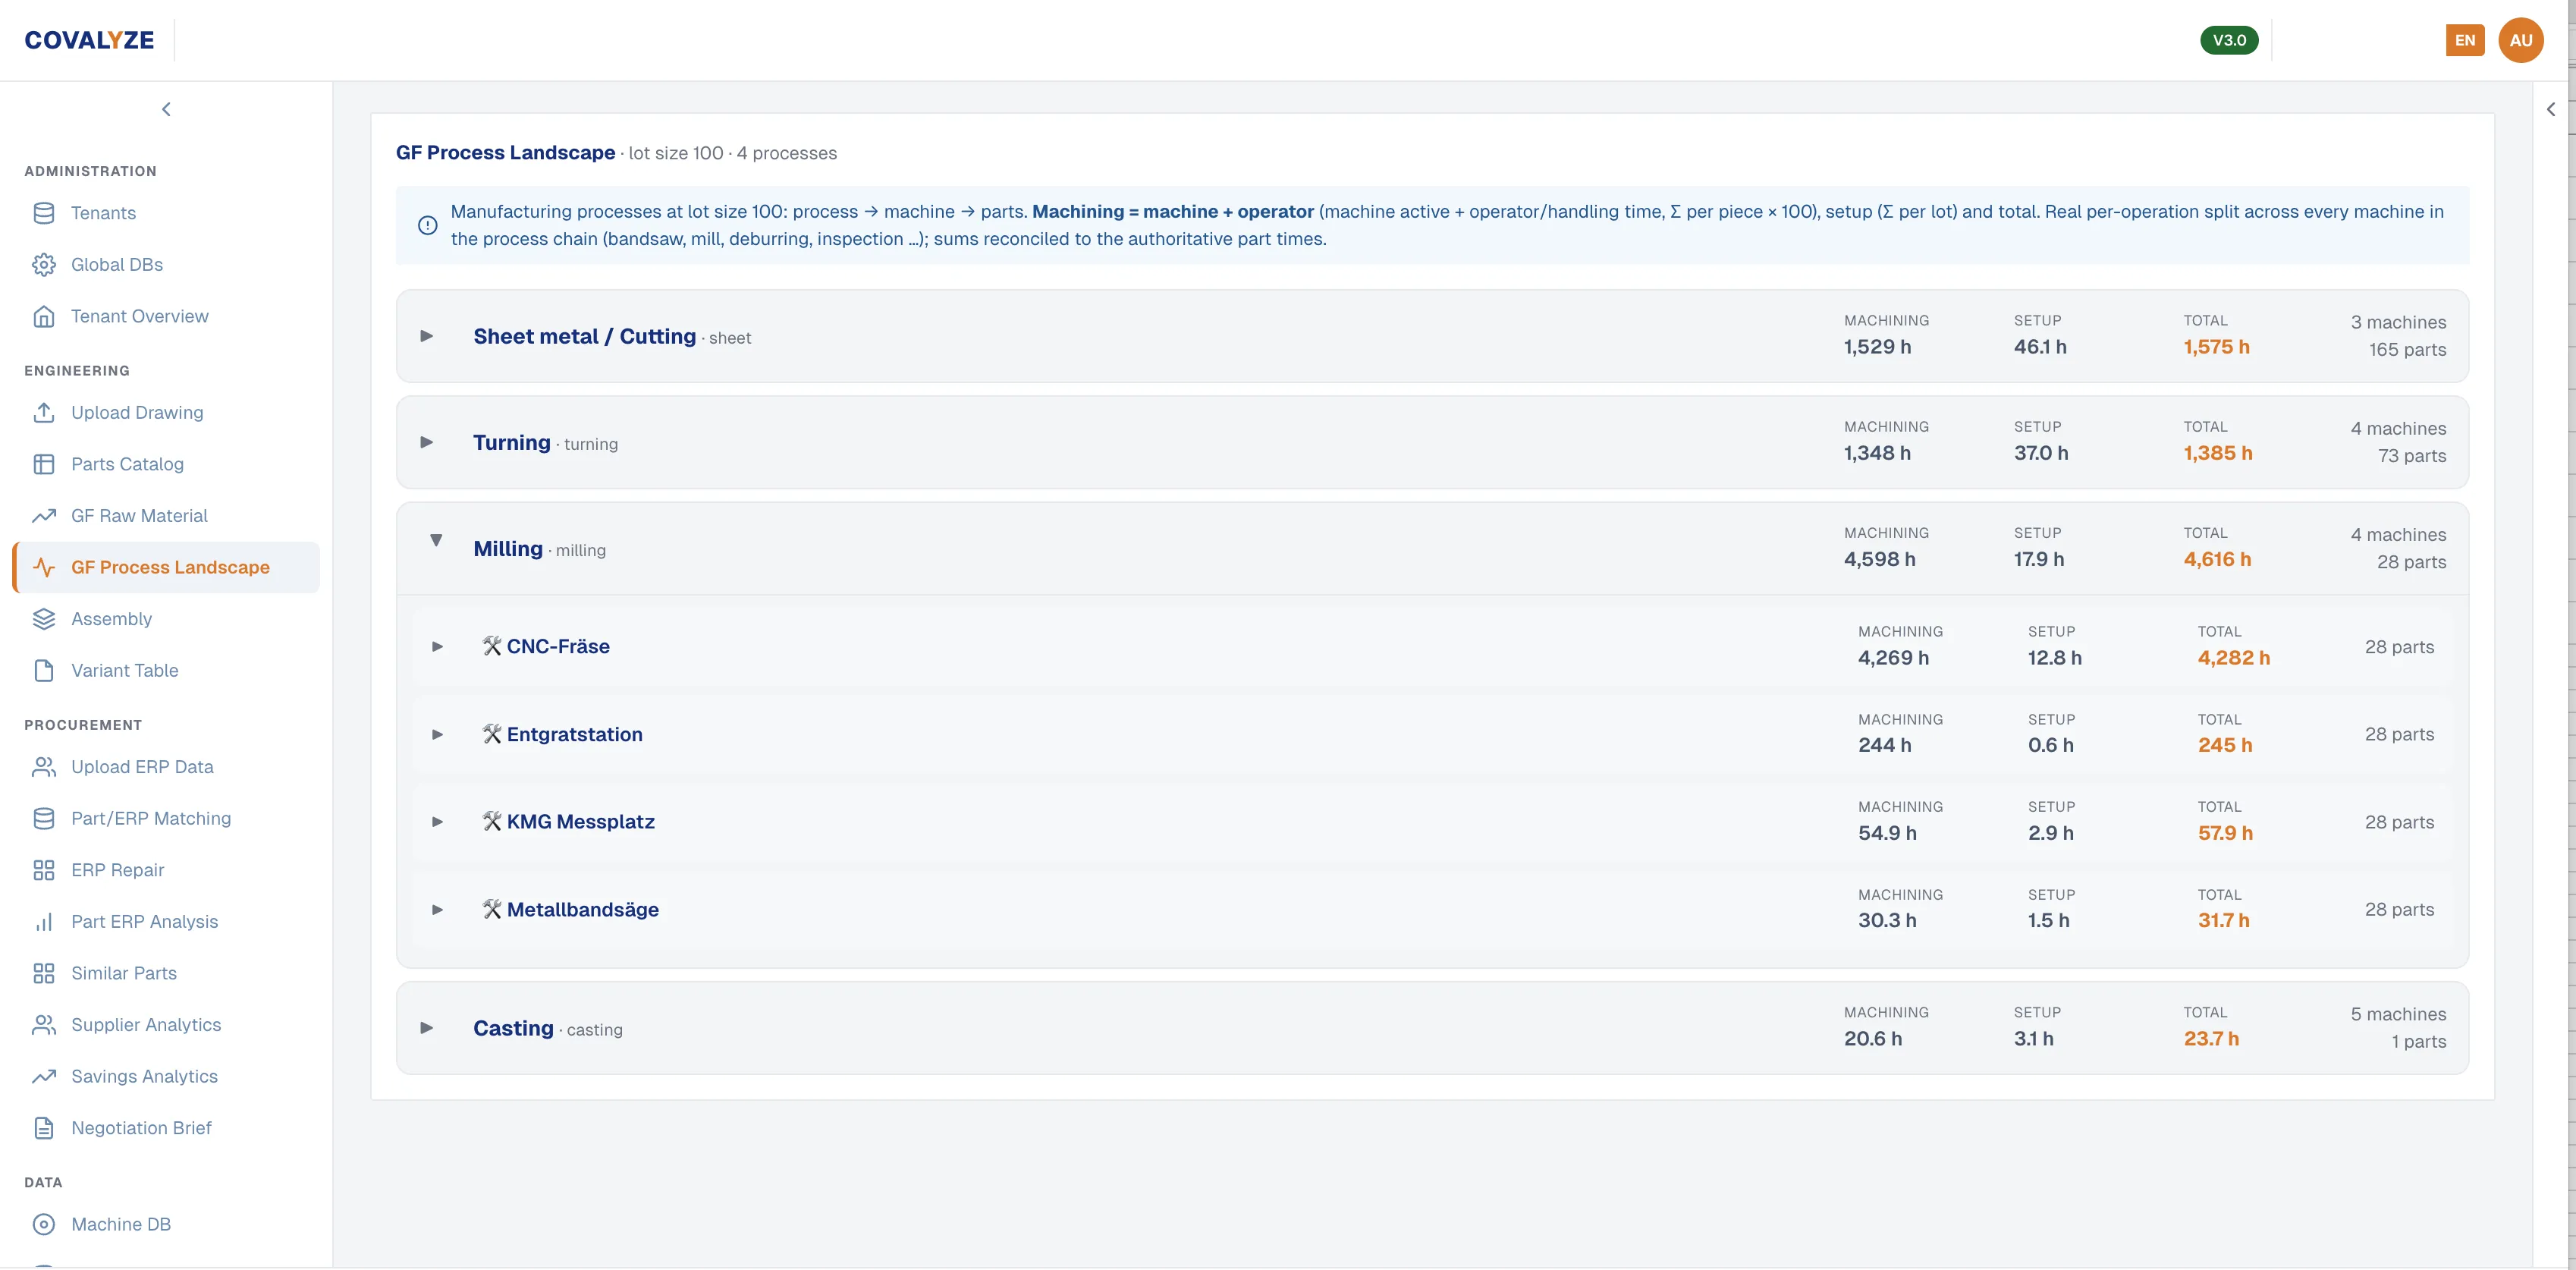
Each process resolves into the actual machines it runs on — fiber laser, CNC mill, bandsaw, deburring station, measuring room — with machining time (machine plus operator) and setup time listed per machine and per part, reconciled against the part times.

DARIN process landscape with sheet metal, turning, milling and casting, each broken down into machines with machining and setup hours
Process families, each resolved into the machines that run them
03 Cost every step

One Formula, Applied To Each Step

Always the same formula: time × machine rate + time × labour rate × operator factor + setup share, then the country’s overhead factor. Material is calculated separately: weight × price per kilo.

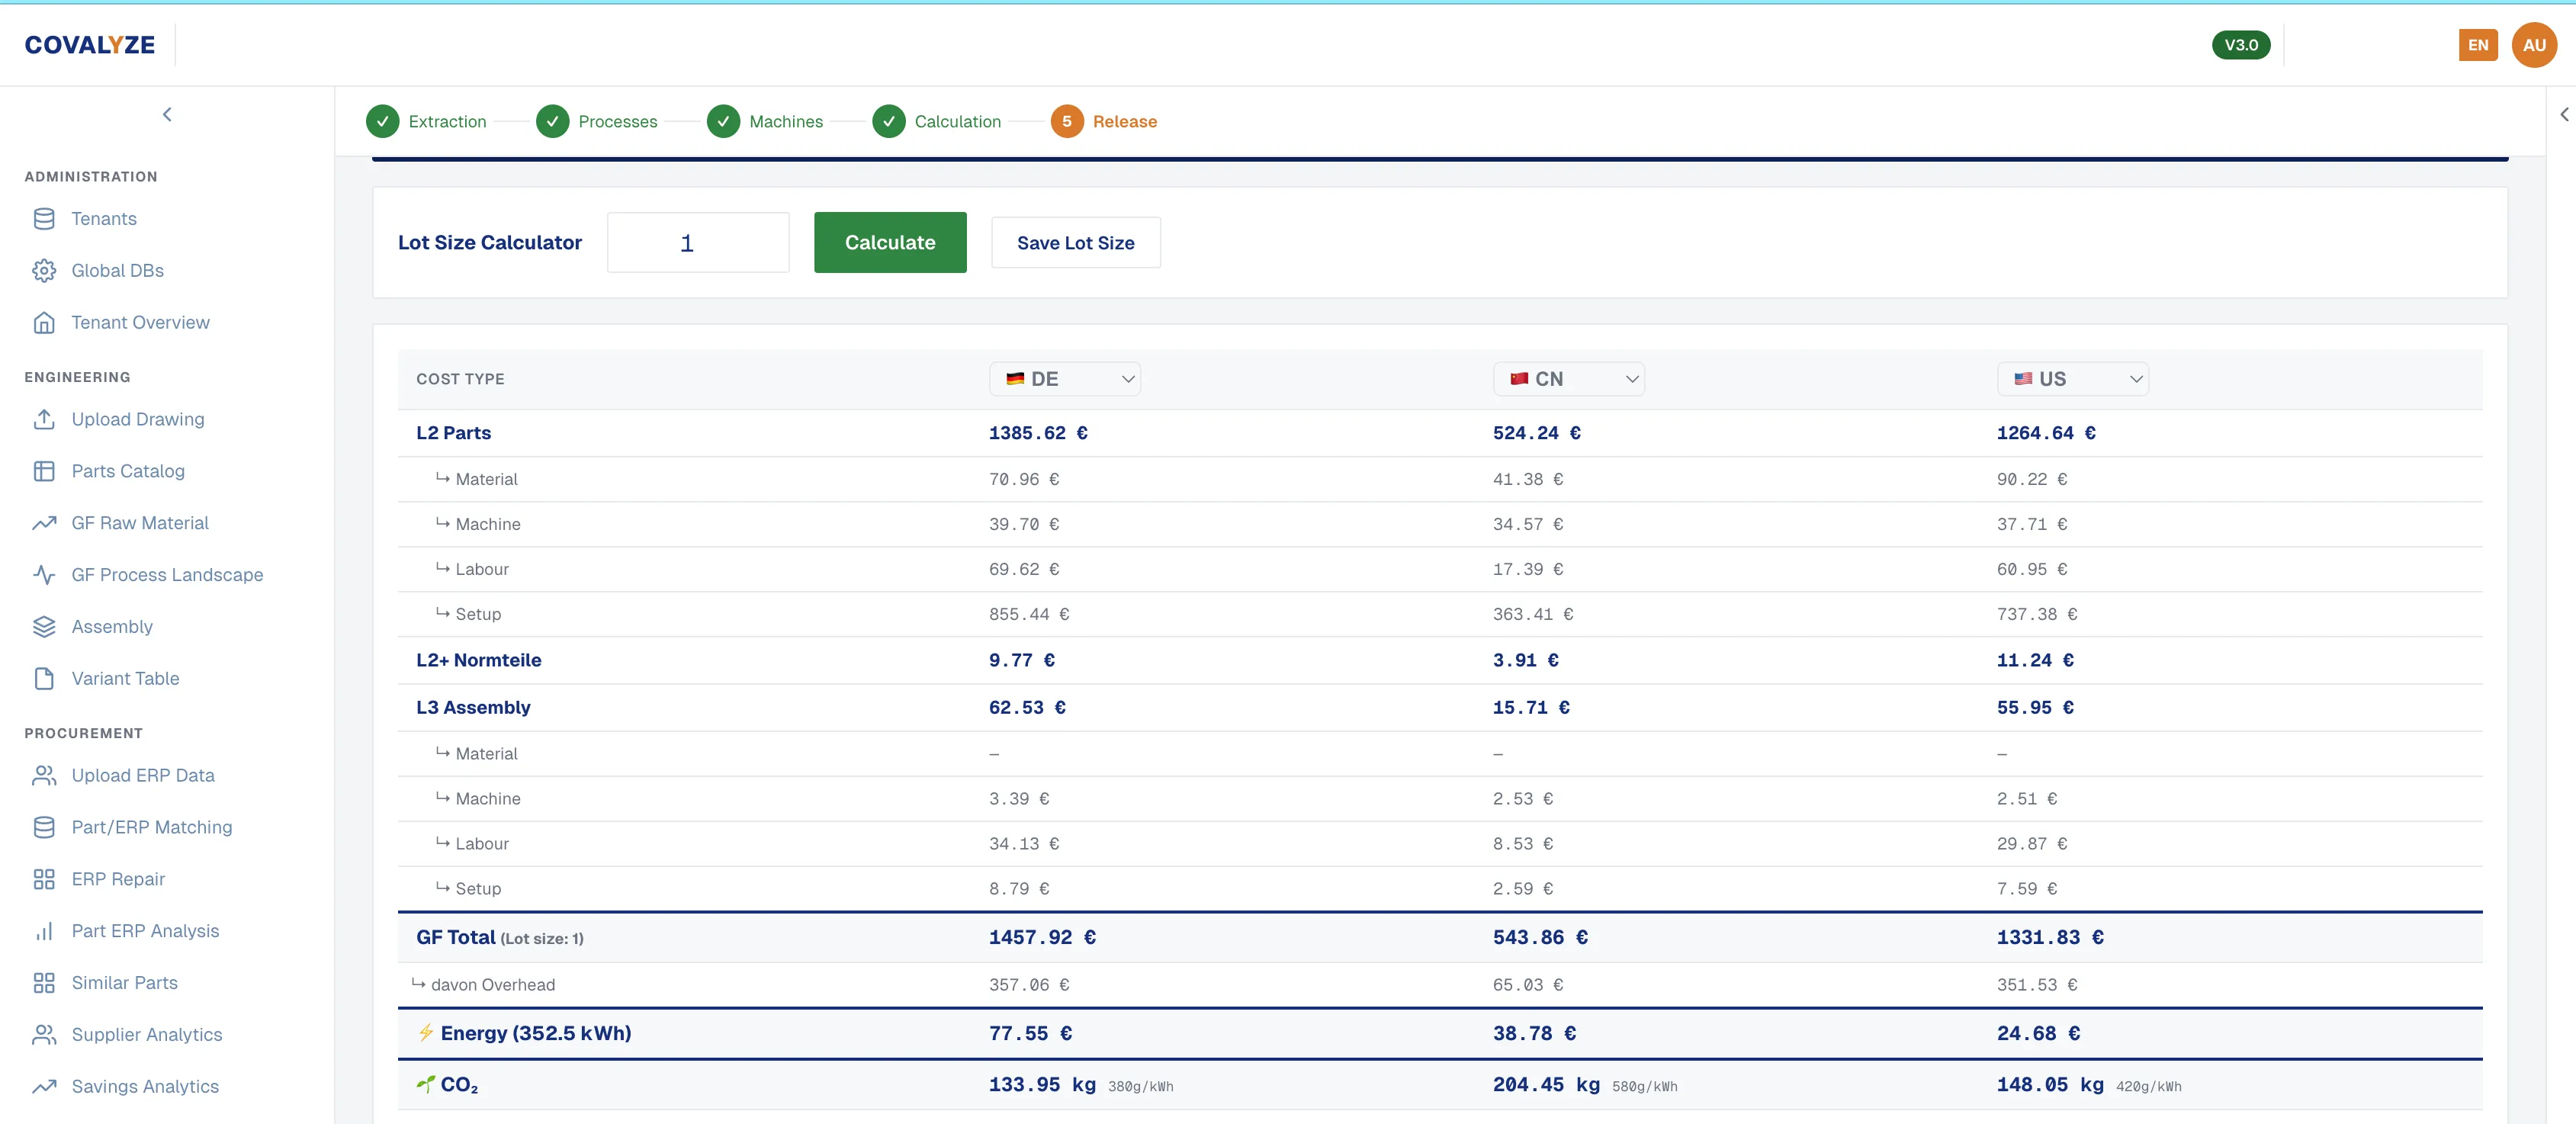
The result is a stack you can read line by line: material, machine, labour and setup per assembly level, the overhead contained in the total, the energy the part consumes in kWh, and its CO₂ — each one priced for the production country you select.

DARIN cost table with material, machine, labour and setup per assembly level, plus overhead, energy and CO2
Material · machine · labour · setup, then overhead, energy and CO₂
04 Play the levers

Five Levers On One Calculation

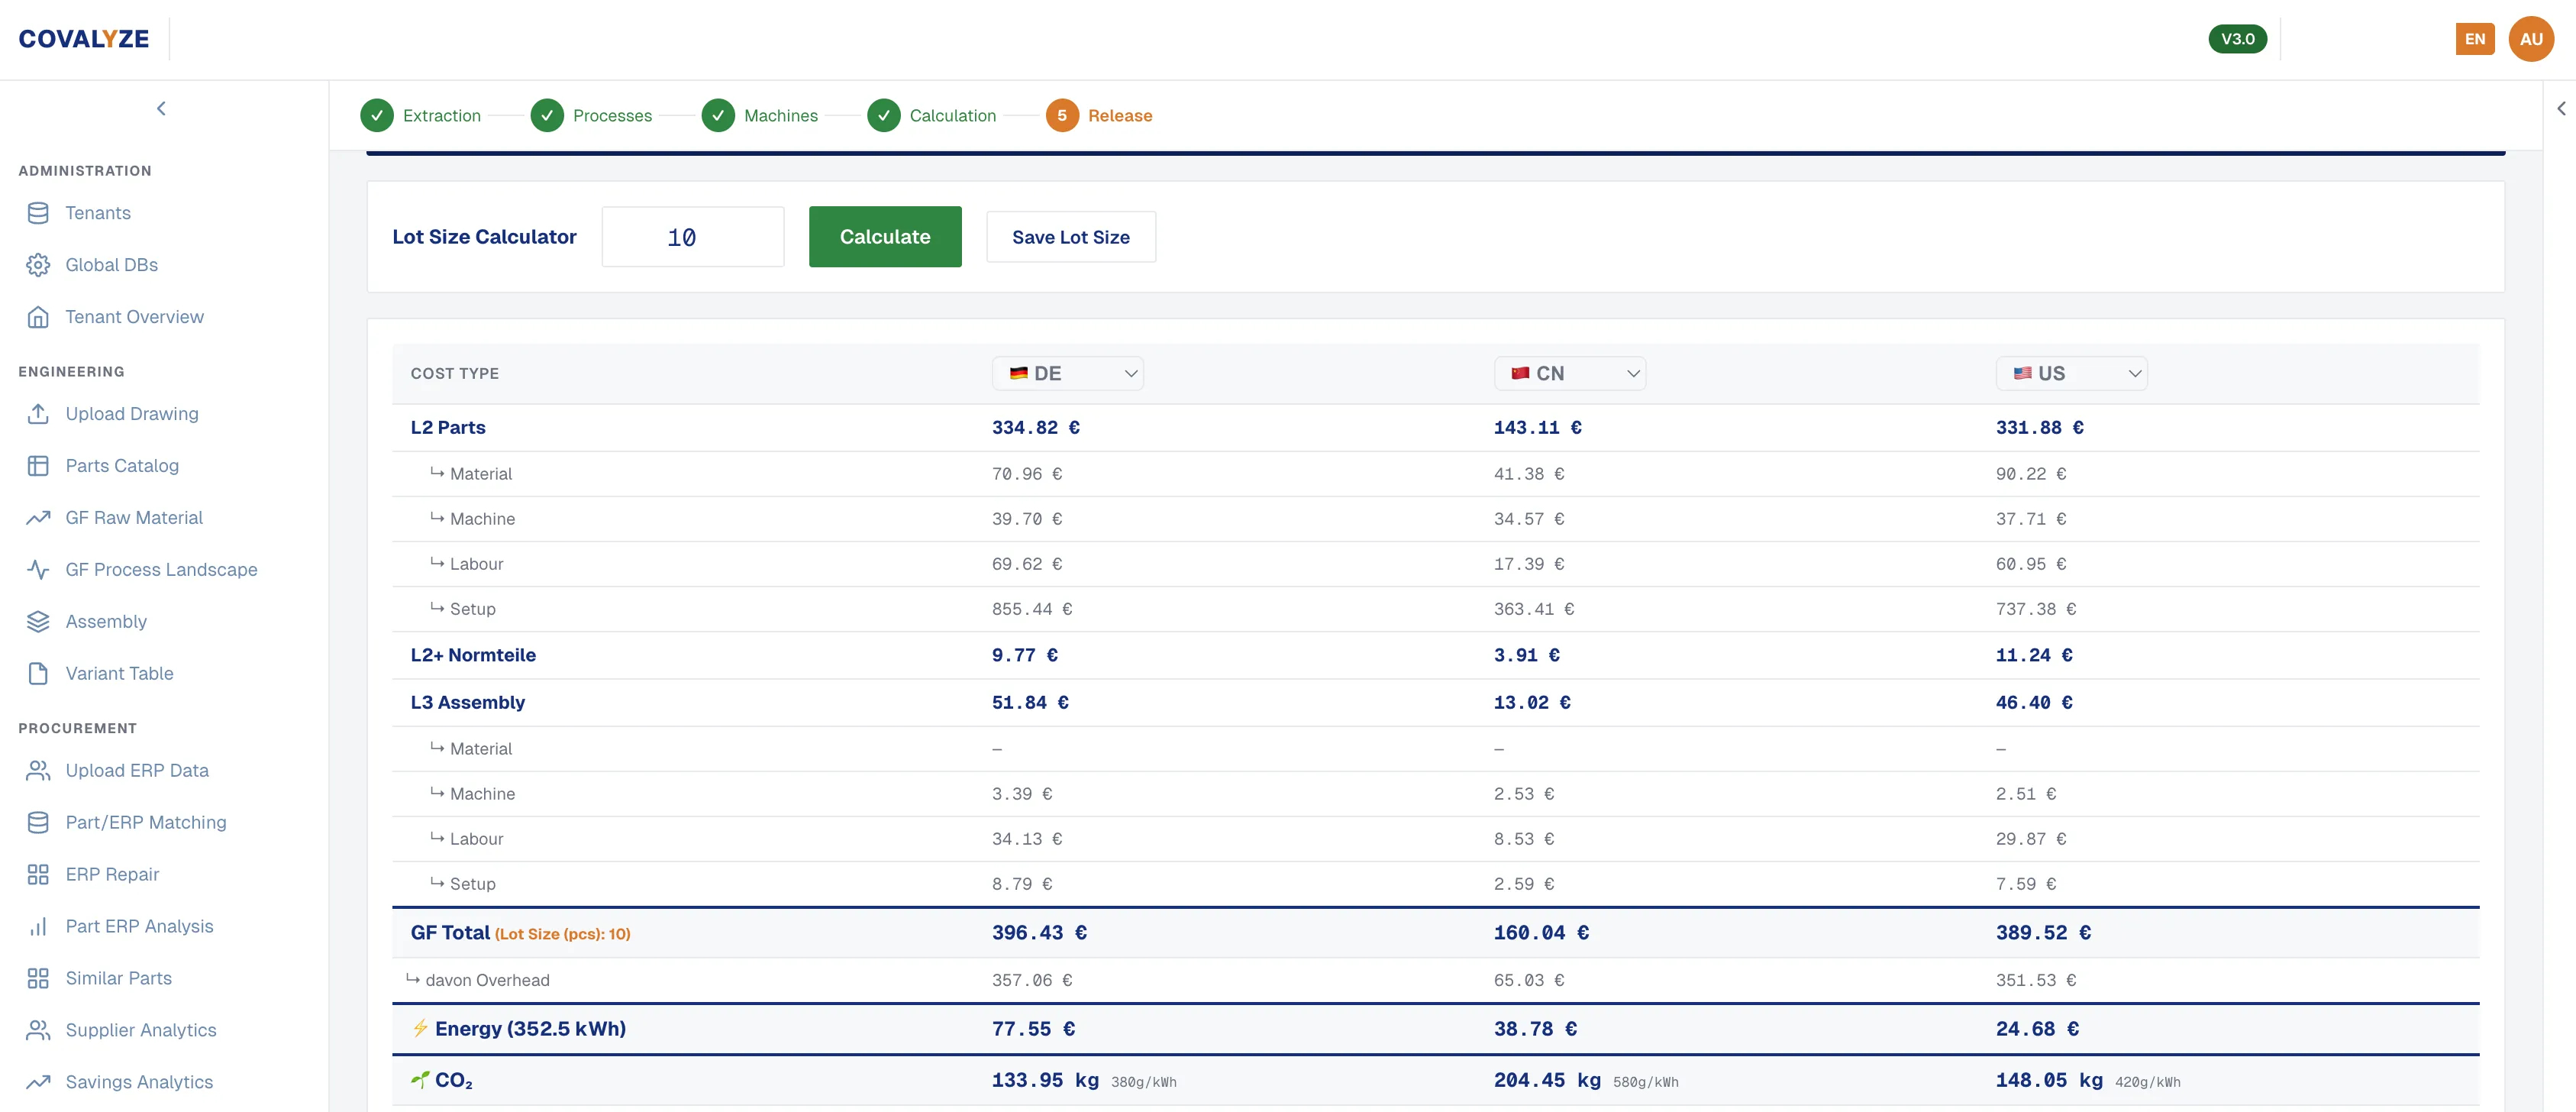
Each lever changes one value in the calculation — material, machine, country, plant rates, lot size — and the whole stack recalculates in front of you.

That is what makes the result actionable: not a percentage for the commodity group, but a named change with a number attached to it.

DARIN lot-size calculator recalculating the cost stack for a lot size of 10
Change the lot size, the country or the material and the stack recalculates

Example · FTE-0001

Recalculate it yourself: 3,700 mm ÷ 5,000 mm/min = 0.74 min

The cut length of FTE-0001 is 3,700 mm — the outline plus the holes, taken from the drawing. The fiber laser runs at 5,000 mm/min. That gives 0.74 min of laser time, which is then multiplied by the machine rate of 38.10 €/h and the labour rate of the producing country.

This is the level at which a supplier discussion becomes technical rather than positional. A cost model always contains assumptions — machine availability, operator factor, scrap, setup times. The difference here is that every assumption is visible, editable and traceable to its source, so you can challenge any single one of them.

Example values from the FTE-0001 sheet-metal part in the DARIN calculator. An example, not a commitment.

Every step, with its formula

The calculation shows its work, operation by operation.

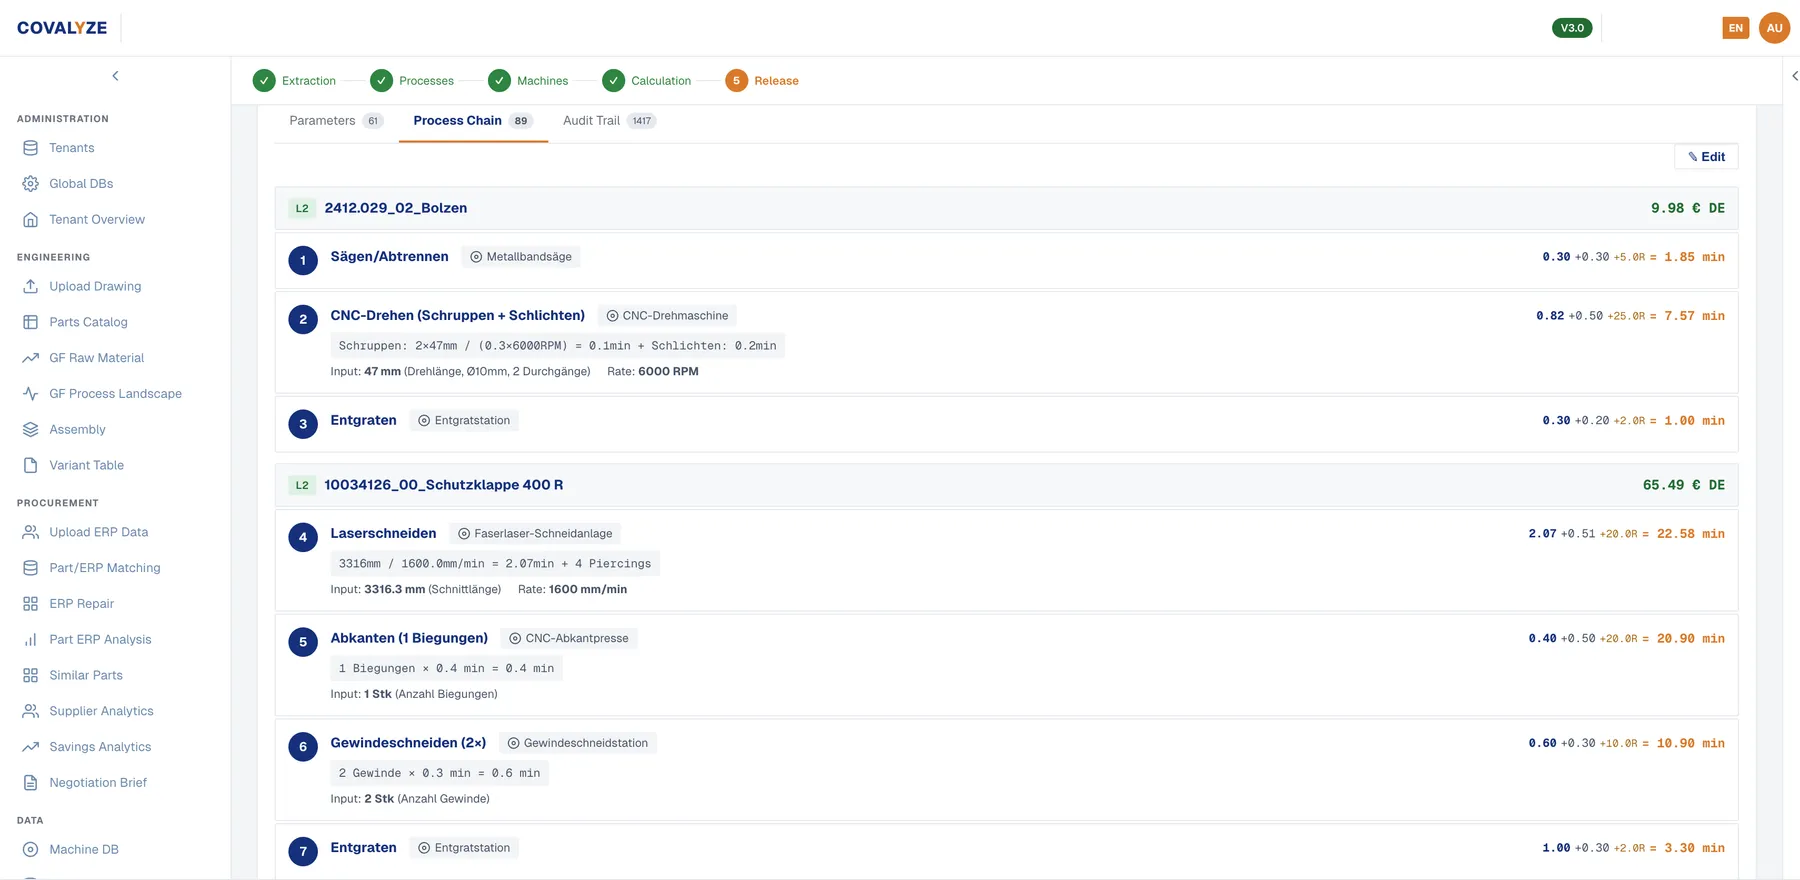
This is the process chain of one calculation: each operation with the machine it runs on, the input taken from the drawing, the formula applied to it, and the resulting time. Cut length divided by feed rate, one bend times its handling time, two threads times theirs. Nothing here is a lump sum you have to accept.

Process chain · per operation Product view
DARIN process chain listing sawing, CNC turning, laser cutting, bending, thread cutting and deburring with the formula and resulting time for each
Laser cutting: 3,316 mm of cut length ÷ 1,600 mm/min = 2.07 min, plus four piercings. Bending: one bend × 0.4 min. Thread cutting: two threads × 0.3 min. Each line names its machine and its input.

Screenshot from a demonstration tenant. Times and rates come from the machine records behind each operation, so they change with the machine — which is what the Automate lever exploits.

Where the values come from

Every input has a source — and it says so on screen.

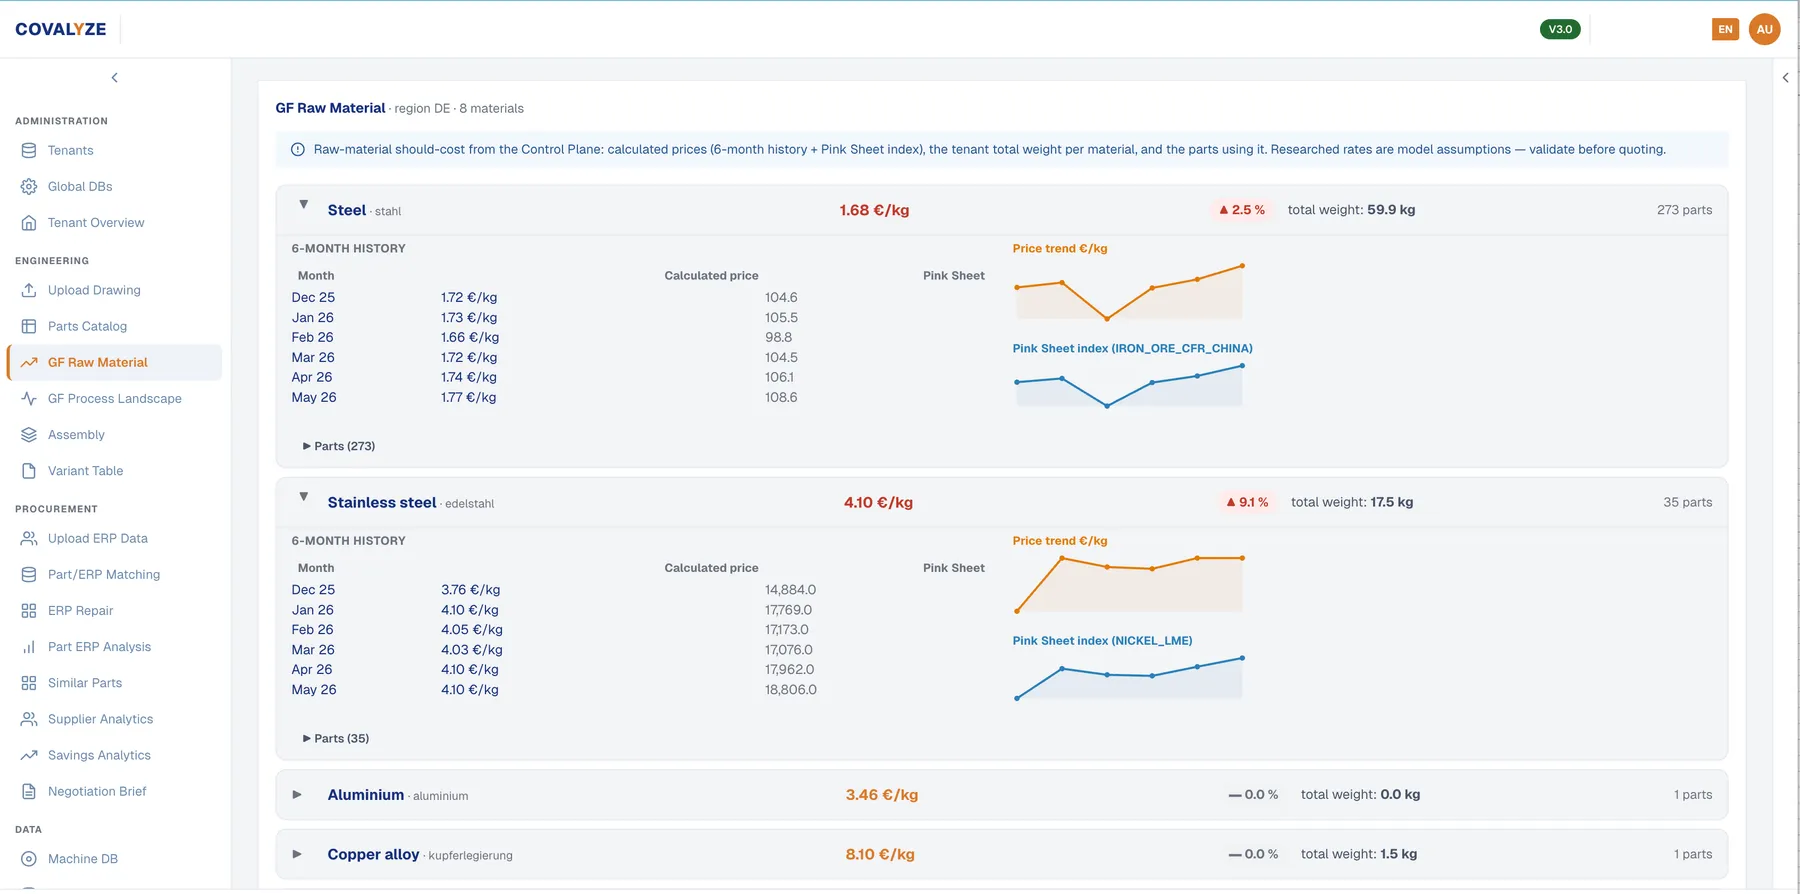
Raw-material prices are calculated per material from a six-month history and tracked against the commodity index, with the total weight in your portfolio and the parts using them. The product states plainly that researched rates are model assumptions to validate before quoting — which is exactly the standard we want held against us.

Raw-material should-cost · region DE Product view
DARIN raw-material view with calculated price per material, six-month history and commodity index trend
Per material: the calculated price per kilo, its six-month history, the commodity index it tracks, the total weight in the portfolio and the number of parts using it.

Values shown are from a demonstration tenant. Material prices move; the figure in your calculation is the one at the time it was run, which is why the history is shown alongside it.

Inside the calculation

The cost stack, element by element.

A piece price is not one number. These are the elements DARIN calculates separately — each with the arithmetic that produces it — so you can see which one actually moves the price on your part.

The cost stack Bottom up, element by element
Material Bought, not made — kept out of the process cost. 1 element
01

Material

weight × price per kilo

Calculated from the weight the geometry implies and the price per kilo for that material. For FTE-0001: steel at 2.12 €/kg and 13.6 kg. Where material dominates the price, no machine change will fix it.

Process cost, per step Every operation in the chain, calculated individually. 4 elements
02

Cycle time

cut length ÷ feed rate

Derived from the geometry rather than estimated: cut length divided by feed rate, bend count times handling time per bend, thread count times its time, and so on for each step in the chain.

03

Machine-hour rate

time × machine rate

The rate of the machine that actually fits the step — 38.10 €/h for a fiber laser against 13.00 €/h for a mechanical shear, each with its own throughput.

04

Direct labour

time × labour rate × operator factor

One operator does not always mean one machine, so the operator factor for that machine is part of it. Rates range from 32 €/h in Germany to 8 €/h in China in the example.

05

Setup and batch allocation

setup ÷ lot size

Setup is calculated once per production run and then spread across the batch. This is why the same part has a different piece price at 50 pieces and at 500 — and why quantity is a lever in its own right.

Production location Applied to the process cost, not to the material. 2 elements
06

Overhead factor

× country factor

Indirect cost and facility overhead differ by production location, so the process cost carries the factor of the country where the part is actually made — not of the supplier's head office. The total shows how much of it is overhead.

07

Energy and CO₂

kWh × price · kWh × g/kWh

The part's energy consumption is calculated in kWh and priced per country, and the same figure produces its CO₂ from that country's grid intensity — so a cheaper location is not automatically a cleaner one.

Assembly structure For anything with more than one part in it. 1 element
08

Levels

made + standard + assembly

For assemblies the stack is built per level: the made parts, the standard parts, and the assembly work itself. You can see whether the money sits in the components or in putting them together.

What it adds up to The should-cost for this part, in the country you select — and from it, the target price.
Per part · per country · per lot size

Example values from the FTE-0001 sheet-metal part in the DARIN calculator. An example, not a commitment.

Confidence and validation

Not estimated, but not infallible either.

How we keep the calculation honest — and what stays your team's call.

  1. 01

    Every assumption is visible

    Material prices, machine rates, labour and overhead factors, setup times: each value in the calculation is listed with where it came from. Nothing is hidden inside a coefficient.

  2. 02

    Extraction is checkable, value by value

    PartIQ reads drawings at >95% accuracy, and every recognised value arrives with its source and a confidence score — marked confident, review or open. The detected process and material are confirmed by a person before the calculation runs.

  3. 03

    You can contradict us

    If your plant runs a different machine, buys material on a different contract or has other setup times, we change the input and the result moves with it. A model you cannot argue with is a model you cannot use.

  4. 04

    Gaps are stated, not filled silently

    Where a drawing does not specify something, we state the assumption we used instead of quietly picking a value. Those assumptions are the first thing to review in the results walkthrough.

  5. 05

    Prices actually paid are the reality check

    Your ERP prices are part of the input. Where the calculation and the paid price diverge sharply, that difference is the finding — and the first thing we examine rather than explain away.

  6. 06

    Similar parts have to agree

    Parts with the same manufacturing route and material are grouped. When two nearly identical parts come out at very different costs, either the data or the price needs explaining.

The calculator

The same calculation, on screen, at a real part.

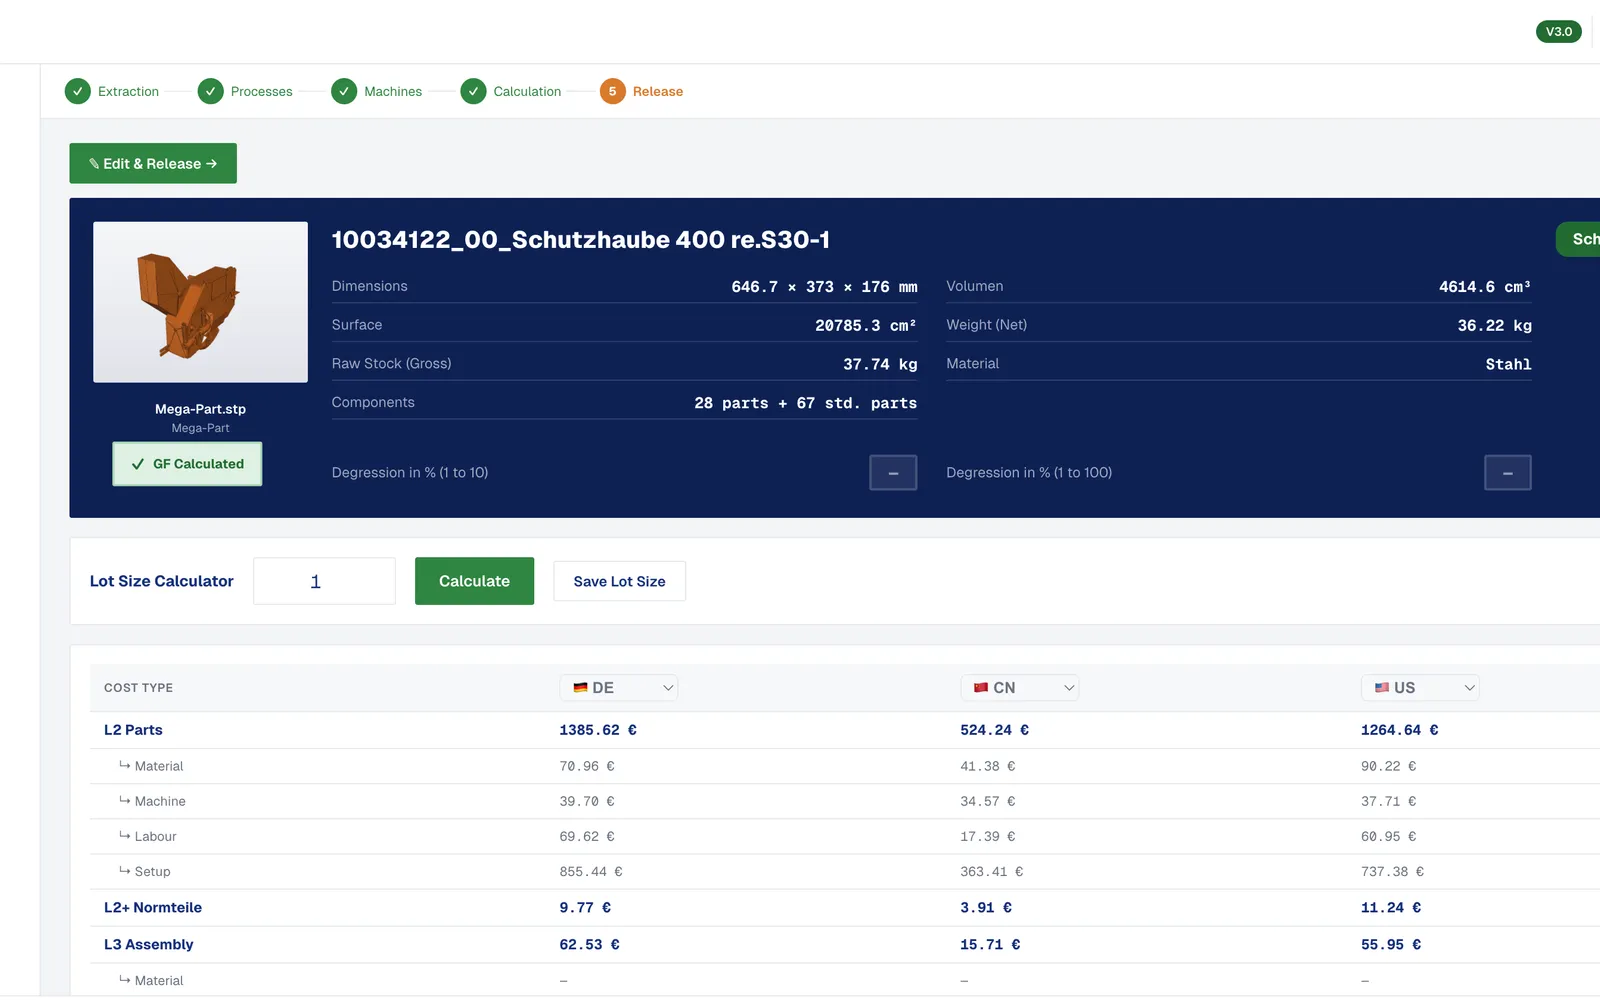
The DARIN calculator holds the FTE-0001 example end to end: attributes, process chain, rates per step, and the five levers as switches. Change the country, the material or the quantity and the piece price recalculates in front of you.

DARIN calculator · assembly should-cost Example part
DARIN should-cost view for a welded assembly with dimensions, weight, components and a per-country cost table
  • Material and weight, with the price per kilo
  • Machine and feed rate per process step
  • Labour, energy and overhead by country
  • Lot size, with setup spread across the batch
Request a live walkthrough
What you get back

The full calculation, step by step.

Send one drawing and you get the whole calculation back — not a summary of it. Every step separately, with all rates, so your cost engineers can rebuild the number themselves if they want to.

Inside a part calculation 9 deliverables
01 The drawing attributes we extracted, as a checkable list
02 The process chain we derived from them
03 Time, machine rate and labour cost per process step
04 Setup time and how it is allocated to the piece price
05 Material: weight, price per kilo, source of that price
06 Country overhead factor applied, and which country
07 The resulting should-cost and target price
08 Each of the five levers, calculated separately
09 Every assumption with its source, and the open questions
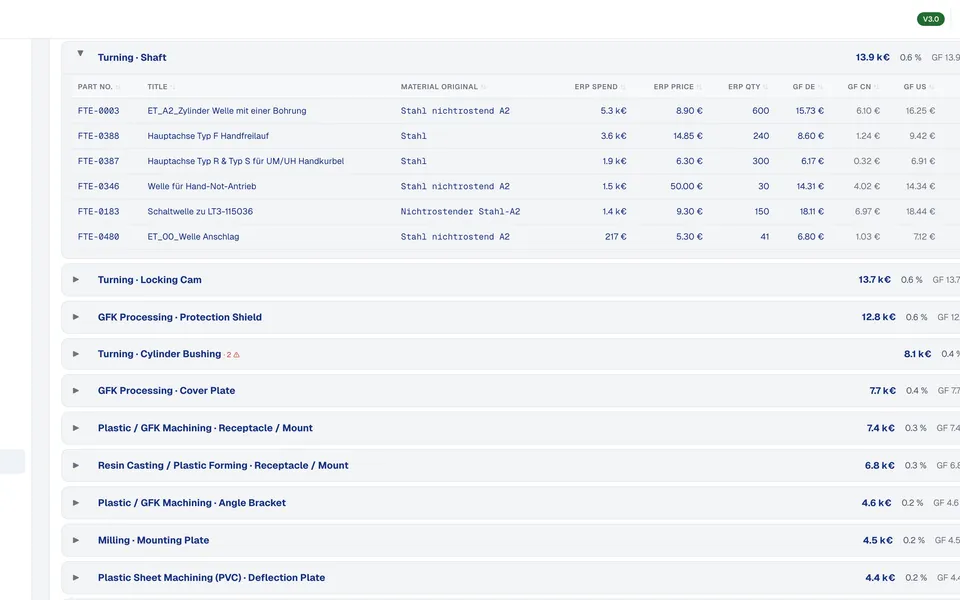
Paid price against should-cost, per part
DARIN cluster view comparing paid ERP price against should-cost for Germany, China and the United States per part
Where the numbers come from

Extraction, data, calculation.

The should-cost calculation is the third step in a chain you can walk backwards: from the target price to the cost element, to the attribute, to the line on the drawing.

  1. Your data Drawings, BOMs, ERP data What you already have — no new system, no new project.
  2. Step 01 PartIQ Reads the technical documents and turns them into structured attributes.
  3. Step 02 COVALYZE Analytics Connects those attributes with your commercial data.
  4. Step 03 DARIN Calculates the should-cost and evaluates the five cost levers.
  5. Result Target prices, scenarios, actions One number per part, with the calculation behind it.
How long it takes

One part is a calculation. A commodity group is a project.

The calculation itself is not what takes the time — a process model we do not have yet is.

  1. 01 One documented part, known process

    First calculation within one business day

    Sheet metal, turned and milled parts, coating: these process models are already in place, so the calculation starts from your drawing.

  2. 02 New or unusual manufacturing process

    Model setup and review required

    We set up the process with times, machine rates and setup logic — typically one additional day. It then stays available, so the next part of that type is a calculation again.

  3. 03 Commodity group, up to 200 parts

    Results in approximately two weeks

    Drawing extraction, data preparation and a results walkthrough for a whole commodity group — this is the fixed-scope Fast Track.

Should-cost calculation — frequently asked questions.

Method

A benchmark compares your price with other prices. A should-cost calculation builds the price from the manufacturing steps the part actually requires — material, cycle time, machine rate, labour, setup, overhead. That is why the result can be defended step by step in front of a supplier, and why it works for parts with no comparable market price.

Data and scope

Minimum input: technical drawing, cad model or specification, current purchase price, annual quantity and order quantity, supplier and production country. Useful extras: bill of materials, routing or process description, material specifications, freight terms and incoterms, supplier quotations, machine and labour rates you already know, quality and lead-time data.

CTA background

Send one drawing. Get the whole calculation back.

You receive every step separately, with all rates and every assumption named — the level of detail a cost engineer can argue with.

Submit a drawing