In low-volume technical procurement, average prices are often misleading. This is especially true in industries such as aerospace and defense, where annual quantities per part can range from one to only a few dozen units, while the underlying technical requirements remain highly specific.
In one recent COVALYZE analysis, the customer faced exactly this: a large, diverse portfolio of technical supplier parts, strong cost pressure, and little confidence that meaningful savings were still available. More than 2,000 different parts were in scope, many of them produced in very low volumes. A category-level negotiation would not have worked here. The only realistic path was a part-specific cost reduction approach, where every part carries its own negotiation story based on transparent cost logic.
The challenge: too many parts, too much technical variation
The analyzed supplier portfolio included 198 part numbers with a spend volume of more than €550,000. COVALYZE analyzed 180 parts, representing approximately 91% of the spend.
The material mix made the analysis particularly challenging:
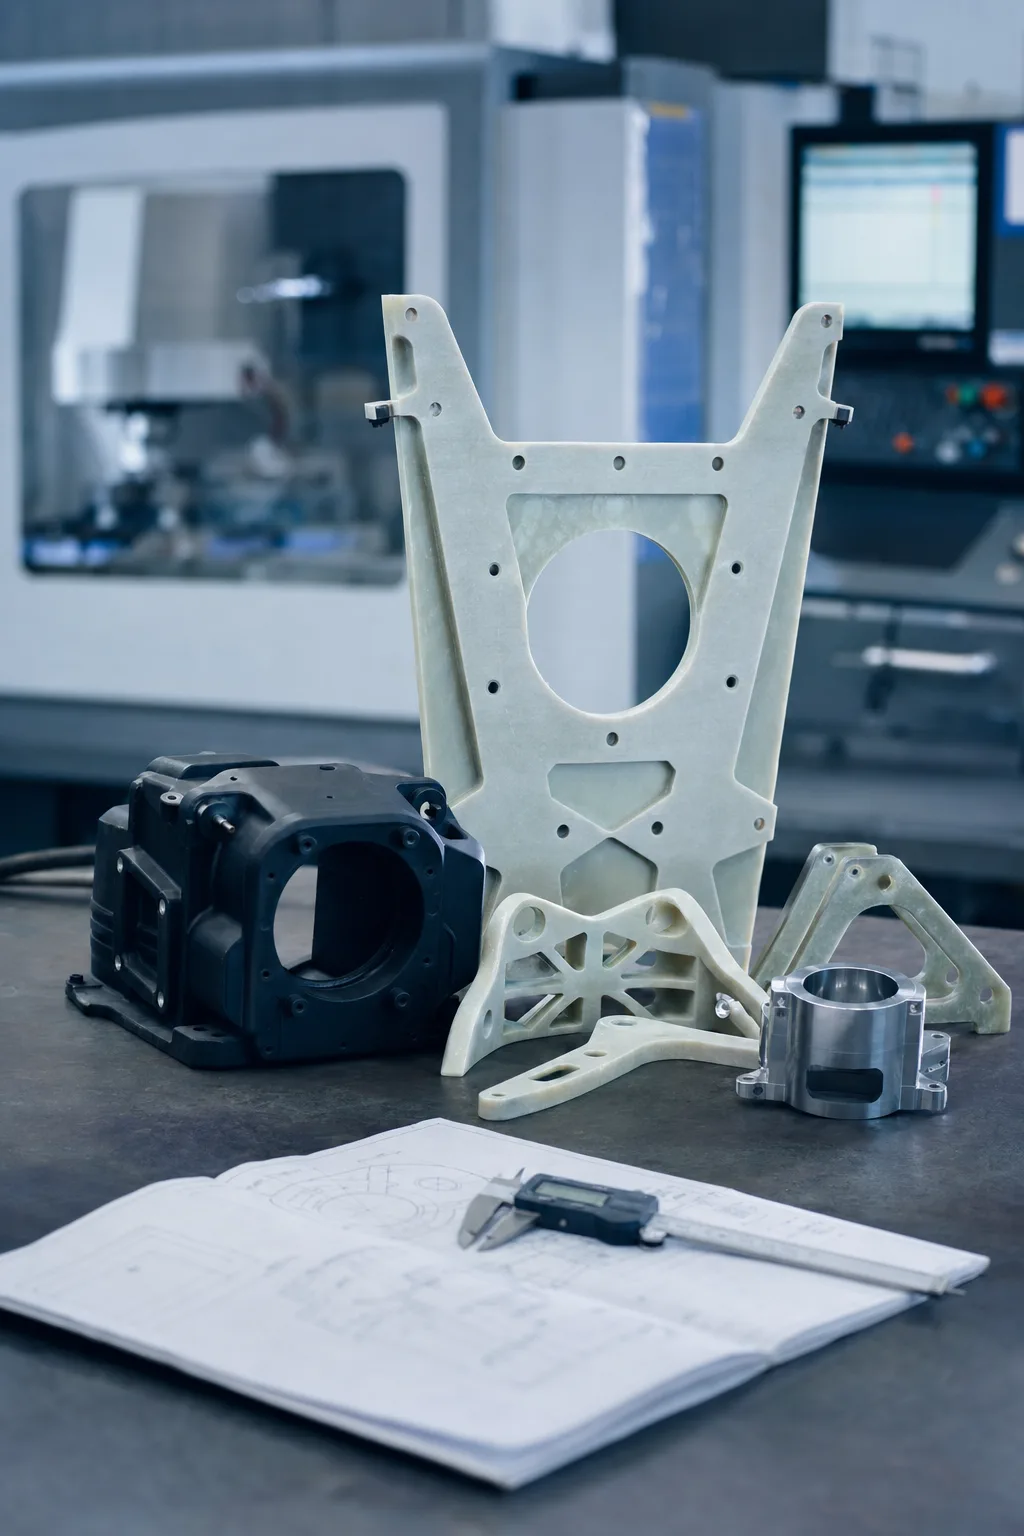
- 45% GFRP parts, glass-fiber reinforced plastic, often used where lightweight strength is required
- 35% plastic / PVC parts
- Remaining share: steel parts
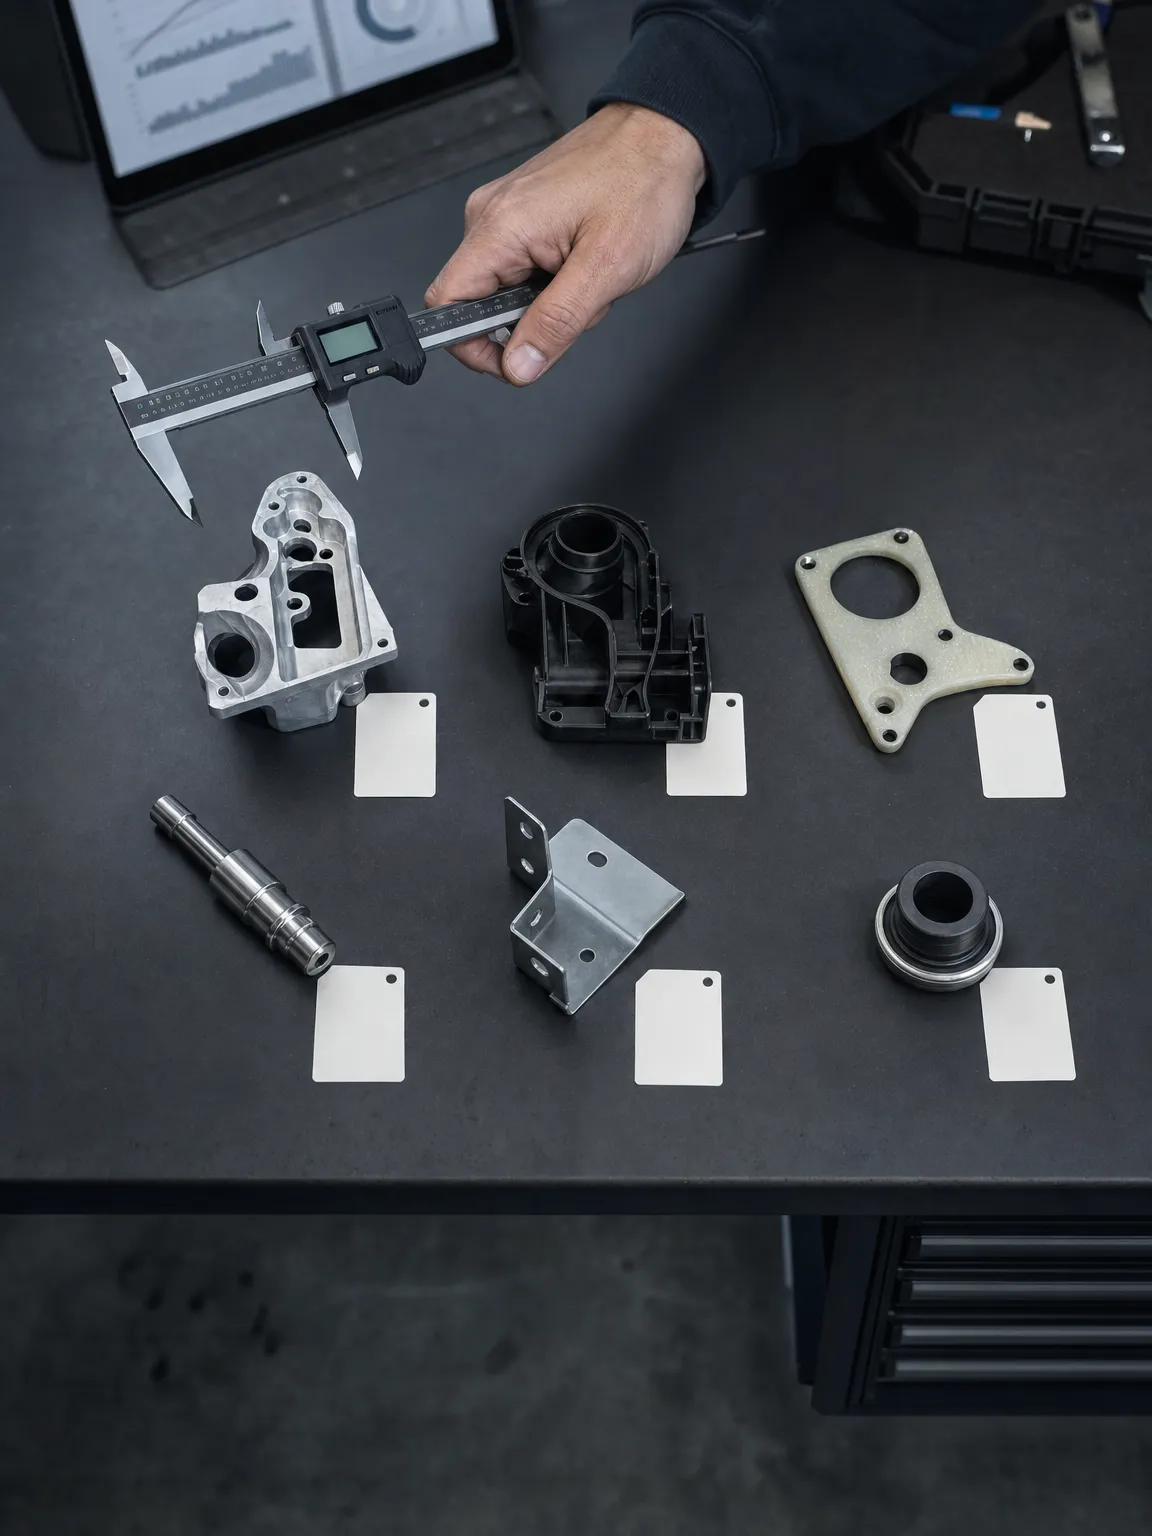
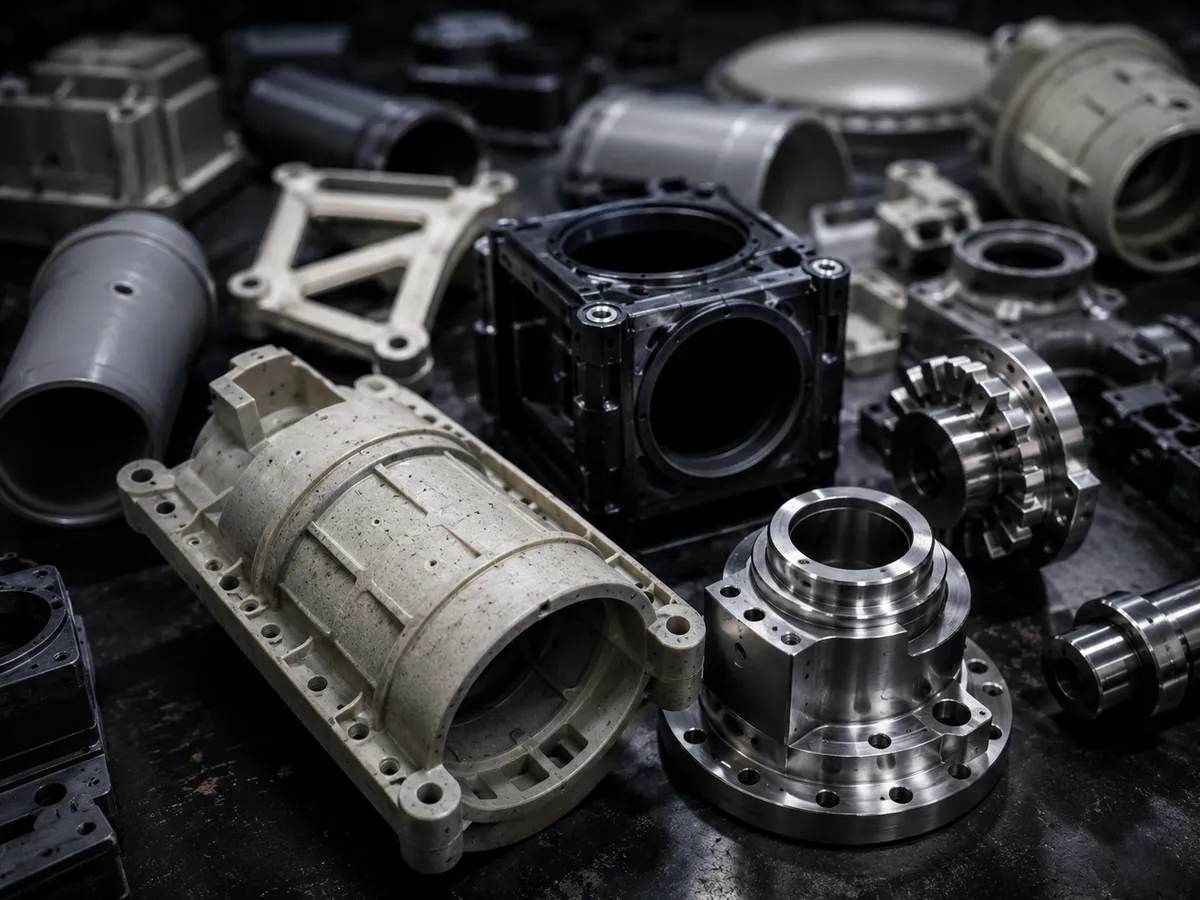
The parts were not complex in geometry, but they were very diverse. Some weighed up to roughly 30 kg, and the manufacturing processes ran from simple sawing out of GFRP plates to milling of GFRP, plastic, or steel blocks. For a conventional consulting team, that much variation means a lot of manual work, because every part has to be understood individually: material, geometry, manufacturing process, and supplier pricing logic reviewed one by one.
Material mix
GFRP, plastic and steel each follow different supplier and process economics. A single average price hides all of it.
Diverse materials, diverse process economics
The portfolio combined glass-fiber reinforced plastic, plastic and PVC parts, and a remaining share of steel parts. Each material group carries its own cost structure, supplier base, and competitive dynamic.
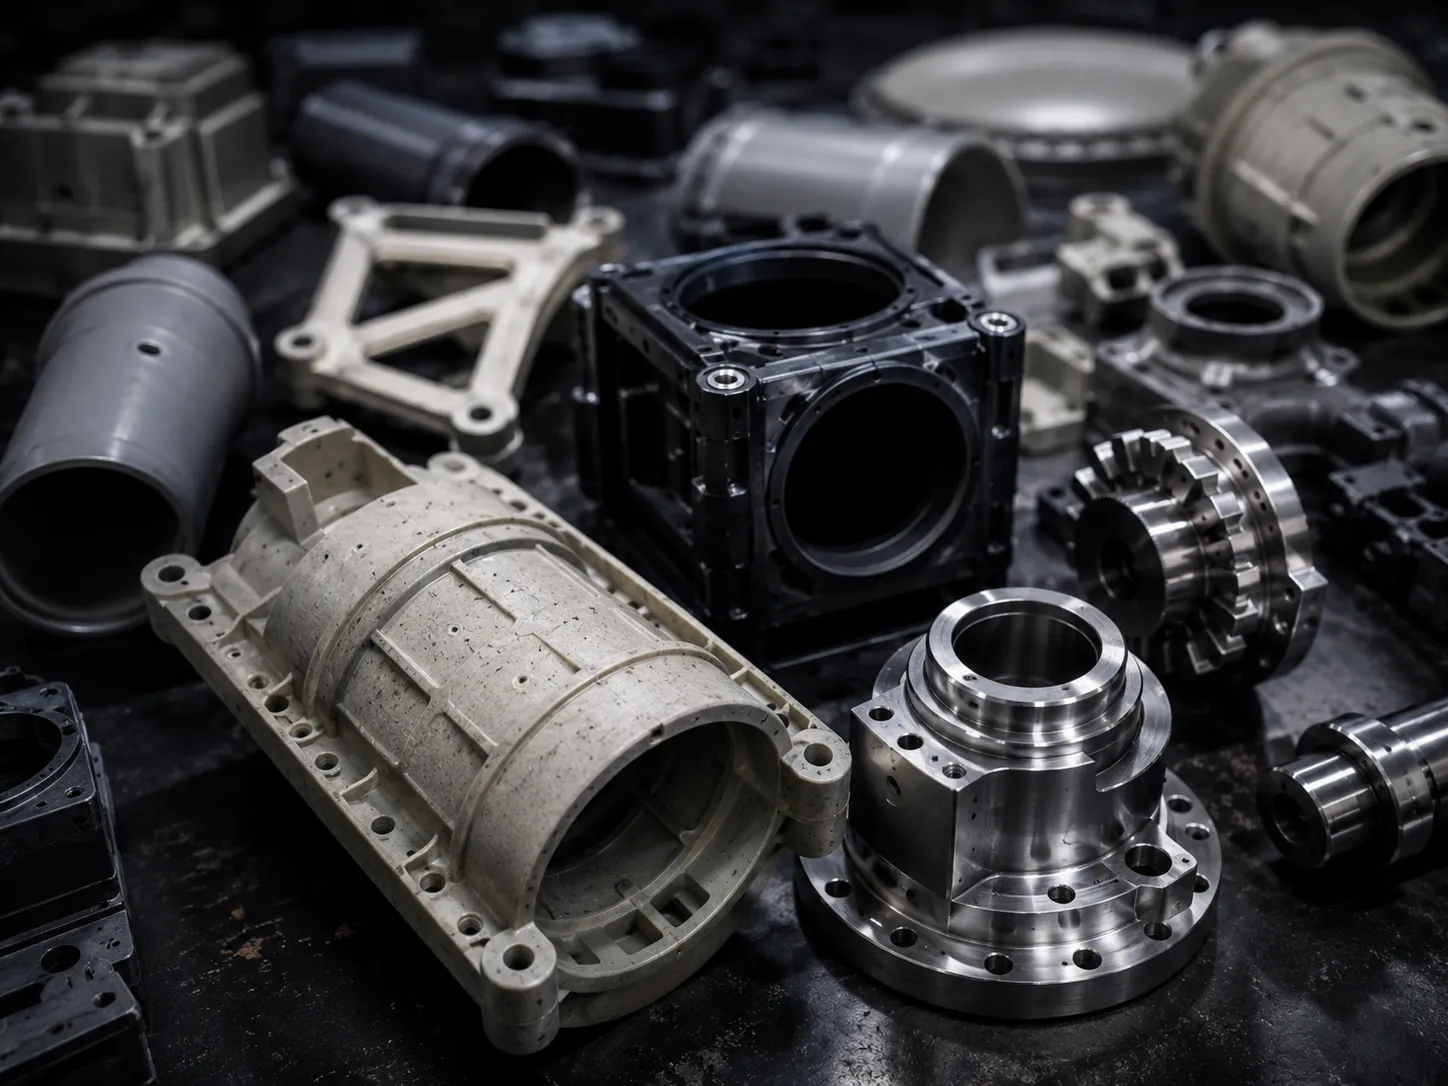
Some parts weighed up to roughly 30 kg, with manufacturing routes ranging from simple sawing of GFRP plates to milling of GFRP, plastic, or steel blocks.
That diversity is why average price-per-kilogram comparisons break down. The same average can sit on top of parts that are competitively priced and parts that are badly overpriced.
Why average benchmarks fail
The customer originally expected little or no savings potential. Part of that was a reluctance to challenge suppliers in a volatile raw material environment. In categories such as GFRP, many companies avoid reopening supplier discussions because asking questions can invite new price increase demands.
The analysis showed something more mixed. The supplier was not uniformly expensive. Some parts were priced above should-cost, while others were already very competitive, in some cases even below calculated cost levels.
Supplier prices are not simply "high" or "low." They reflect competition, material category, supplier power, technical process logic, and historical pricing behavior.
Steel parts, for example, were priced much more competitively, most likely because the supplier faced stronger market competition there. GFRP parts sat at higher price levels, which fits a more specialized supplier base and weaker competitive pressure. A normal category review would never have surfaced that split.
The COVALYZE approach
COVALYZE created a part-level should-cost analysis for the analyzed portfolio. For each part, the calculation was broken down into:
- Material costs
- Machine time
- Labor share
- Processing steps
- Additional manufacturing requirements
- Greenfield and brownfield cost logic
- Supplier margin indications
That let the customer see where the potential sat and why. Across the analyzed spend, the analysis identified roughly 20% savings potential. Extrapolated to the full dataset, the number would be higher still.
The savings figure was not the most useful output, though. What mattered was that the savings could be explained part by part, which changed the negotiation. Instead of opening with a generic target such as "reduce prices by 10%," the customer could discuss individual components with a clear cost logic behind each one.
The credibility test: conservative savings instead of inflated potential
A major reason the customer accepted the results was the transparency of the calculation. Every assumption could be reviewed:
- Which material price was used?
- Which machine time was assumed?
- Which labor share was calculated?
- Which manufacturing step drove the cost?
- Which parts were already competitively priced?
That mattered because the initial savings potential looked surprisingly high. The customer challenged the numbers, and rightly so: a savings estimate of around 20% in a technically demanding low-volume portfolio has to be defendable. COVALYZE could defend it because the analysis rested on individual part calculations rather than averages.
The hidden data issue: incorrect GFRP weight logic
During the analysis, COVALYZE also ran a sanity check between the 2D drawing data and the 3D geometry. That surfaced a likely systematic issue in the customer's PLM or master data logic for GFRP parts.
The 2D drawings showed weight values that were roughly half of what the 3D geometry indicated. After manual checks, the likely explanation was a default density value of 1.0 for GFRP in the PLM system, while a more realistic density assumption for the analyzed GFRP material was around 1.9.
Data-quality check
A good should-cost analysis is built to be trusted, not to produce the largest possible savings number.
The team did not exploit the lower weight to inflate savings
COVALYZE did not take the lower 2D weight value and let the savings potential look larger.
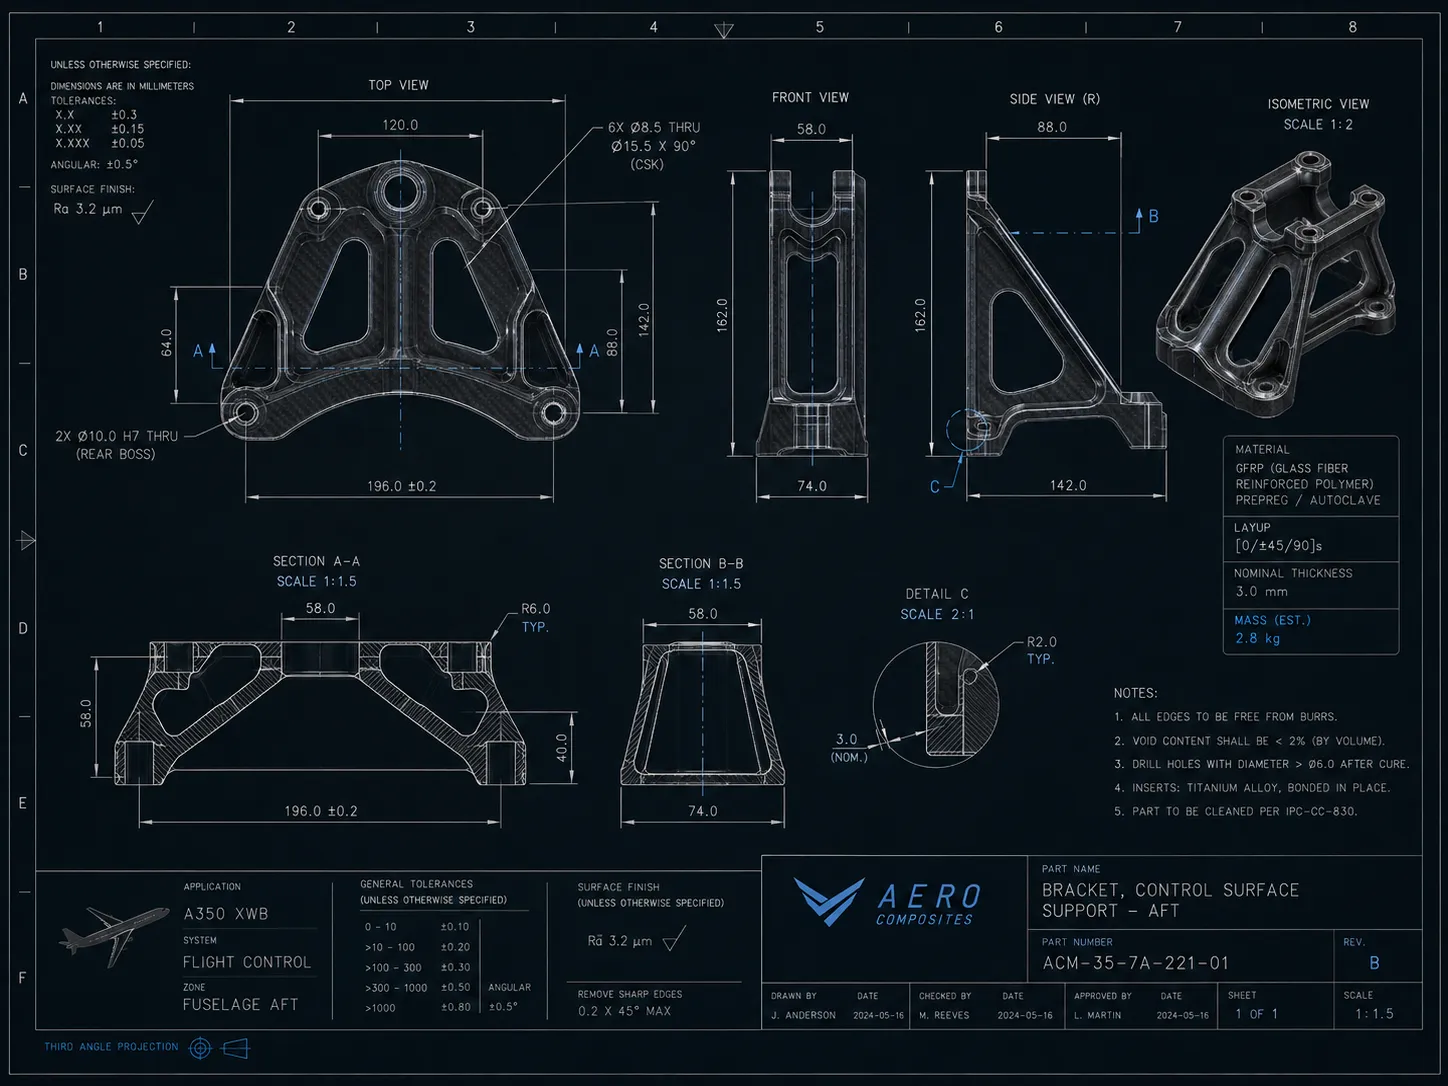
The team validated the 3D geometry, checked the volume and weight logic, and used the corrected higher weight for the cost calculation. The result came out more conservative and more credible.
With the lower 2D weight values, the calculated savings potential would have been considerably higher, and it would have overstated the supplier-side cost gap.
Why this matters beyond procurement
The likely PLM issue is not only a costing problem. Incorrect weight values feed into several operational processes:
- Logistics planning
- Transport cost assumptions
- Warehouse capacity planning
- Load calculations
- Supplier discussions
- Material cost evaluation
If a company works for years with incorrect weight assumptions for a material group, the commercial impact spreads well beyond purchasing. At that point technical cost analysis doubles as a data-quality instrument for the whole organization.
What procurement teams can learn
This case shows why low-volume technical procurement needs a different approach. For diverse parts with annual volumes between one and a few dozen units, broad benchmarks and average price-per-kilogram comparisons do not hold up. What teams need instead:
1. Part-level should-cost logic
Each part needs its own cost story.
2. Material-specific interpretation
GFRP, plastic, and steel follow different supplier and process economics.
3. 2D and 3D validation
Drawing data and 3D geometry should be challenged against each other.
4. Transparent calculation assumptions
Negotiation arguments only work if material prices, machine times, and labor assumptions are explainable.
5. A conservative view of savings
The useful number is the one that survives supplier scrutiny, not the highest one.

Conclusion
Averages do not manage technical procurement well when parts are diverse, volumes are low, and materials are specialized. By analyzing 180 low-volume technical parts at part level, COVALYZE created a transparent negotiation basis, identified around 20% savings potential, and uncovered a likely PLM data-quality issue in the GFRP weight logic.
In complex technical procurement, the strongest negotiation position comes from knowing the cost logic of every individual part.
For procurement teams in aerospace, defense, and other low-volume technical environments, see how COVALYZE Analytics and PartIQ turn diverse, low-volume portfolios into part-by-part negotiation leverage.