
Opening Brief
At a Glance

Our Client
A small-to-mid-sized industrial manufacturer in the energy sector — a hidden champion in medium- and high-voltage components, recently acquired by a private equity investor with a clear mandate for operational improvement and value creation.
With around 500 employees and its largest site near Munich, the company produces classical components and systems for the power and grid environment. Strong engineering. High variant complexity. Low piece volumes. A profile shared by many of Germany's most capable Mittelstand manufacturers — and one that creates structural disadvantages in procurement if left unaddressed.
Using COVALYZE PartIQ and COVALYZE Analytics, the project team connected fragmented technical drawings to ERP spend data, quantified the real drivers of supplier pricing, and gave procurement the evidence base it needed to negotiate with confidence.
Key Figures
Largest parts by average 3-year spend — the economically relevant core of the category.
The true scale of the part universe, far beyond the initial scope.
Based on 3-year average to account for project-driven spend volatility.
Roughly 8–10% of the analyzed annual spend, with further upside in adjacent categories.
Quantified to 1% accuracy — the single most important commercial lever identified.
Consolidated from approximately 50 raw material spec variants in the source data.
Problem Frame
The Challenge

The engagement was triggered by the PE acquisition. During due diligence, procurement and material cost optimization had already been flagged as key value-creation levers. What the team discovered when they started looking was a data environment that made even a basic cost analysis difficult.
Disconnected Data Across Two Worlds
Commercial data lived in SAP. Technical data lived in engineering and PLM systems. The two were not linked. Retrieving drawings for a specific part meant entering part numbers one by one into a separate system and downloading each file individually. For 50 parts, that was already a manual effort most lean Mittelstand organizations cannot easily absorb.
The drawings themselves ranged from modern digital files to documents dating back to 1995 — some with handwritten elements, some inconsistently labeled, most containing no structured metadata that could be used for analysis.
What Was Invisible
- » No quantified view of which technical or commercial variables actually drove supplier pricing
- » No clean digital bridge between ERP spend data, supplier allocation, and engineering drawings
- » No scalable process to retrieve and interpret drawings — each had to be pulled manually, part number by part number
- » No reliable way to distinguish procurement intuition from measurable sourcing economics
The Real Problem
The company sensed that order quantity mattered — experienced buyers had intuitions about it. But intuition cannot be used in a supplier negotiation. The real problem was the absence of a measurable link between technical part characteristics, order volumes, and actual purchase prices. That link had never been built.
Execution Design
Our Approach
Data & Input Structuring
The first step was selecting the right scope. Rather than attempting to cover all 200+ active parts, the team identified the 50 high-runners — the parts with the highest average annual spend over three years. Spend was averaged across three years to neutralize the volatility inherent in this company's project-driven order pattern.
Part Selection
ERP data was used to rank parts by economic relevance. The top 50 represented the spend core of the category — a focused sample with enough commercial weight to generate decision-grade insights.
Drawing Digitization
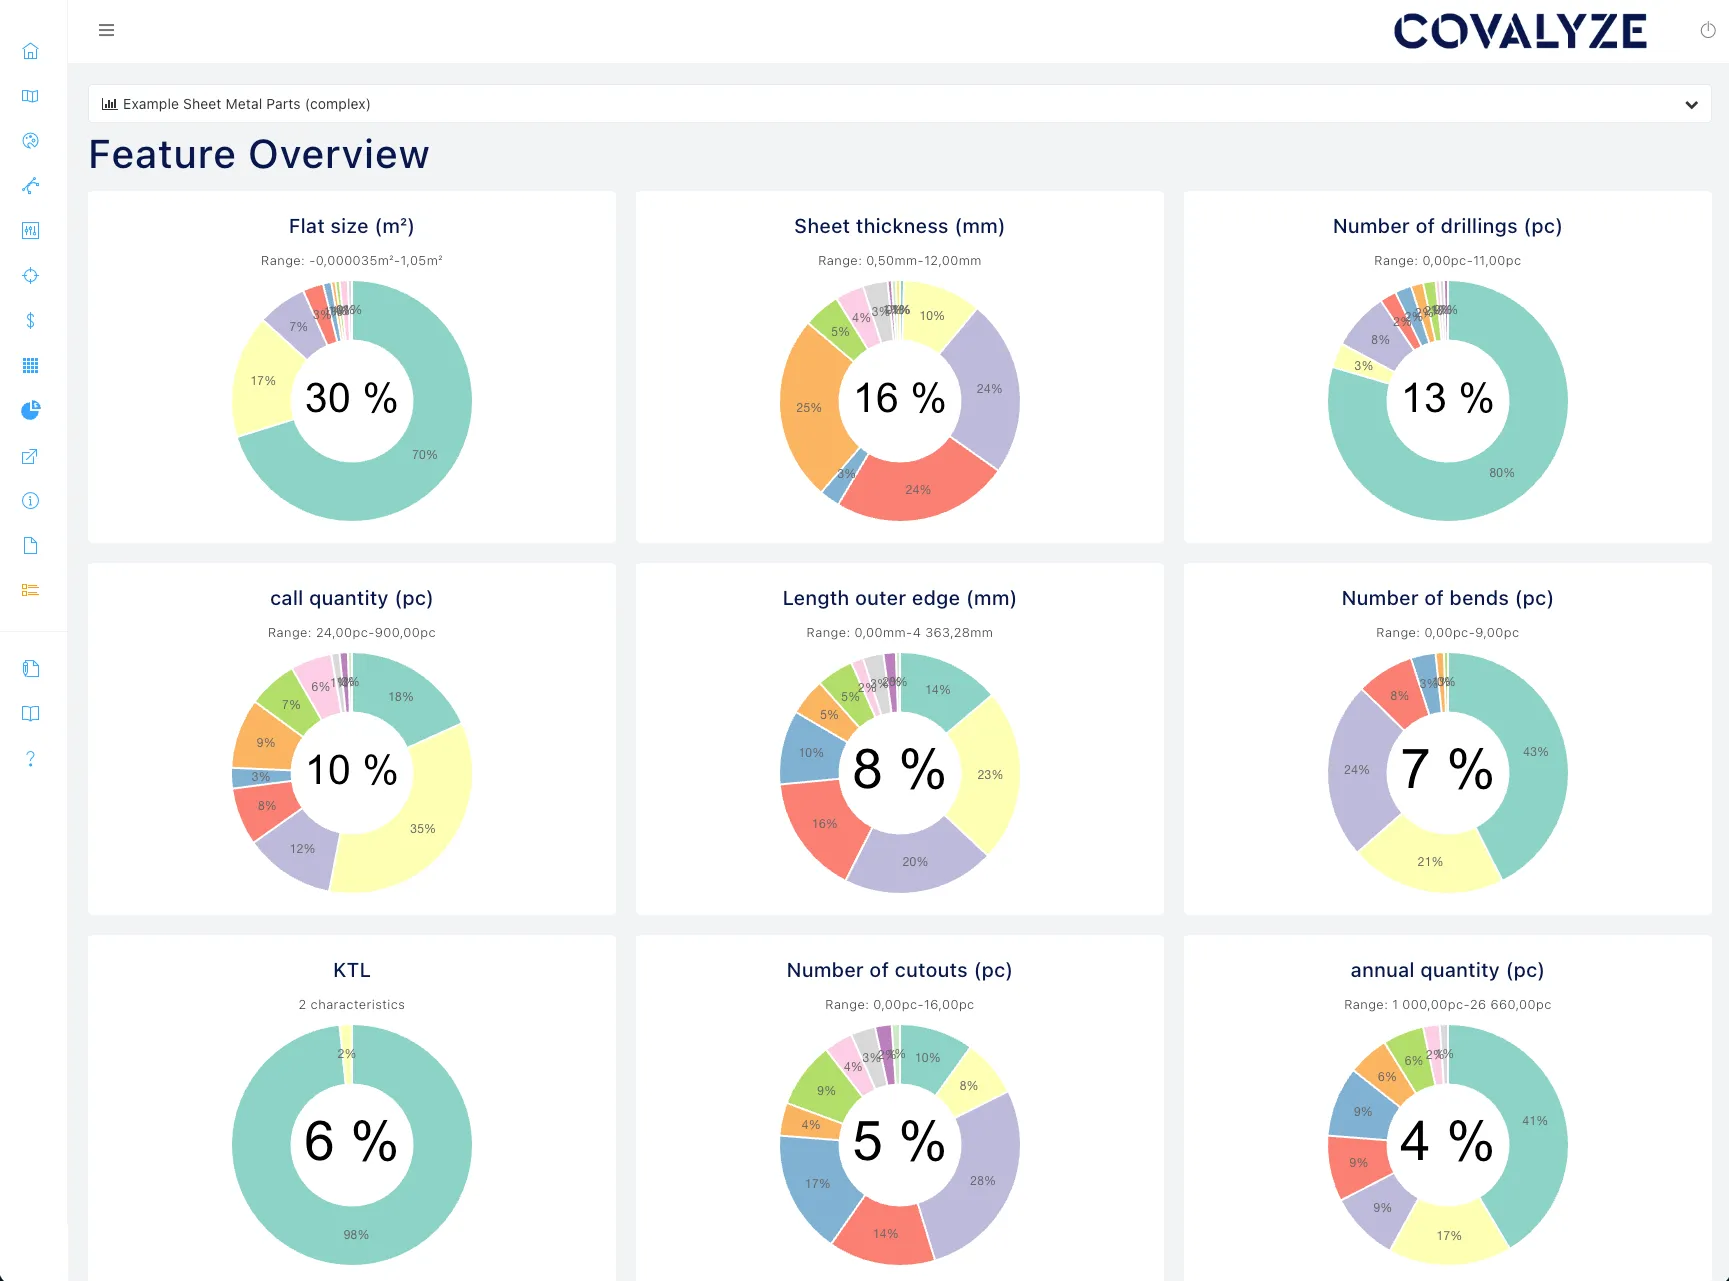
Technical drawings for the 50 parts were retrieved from engineering systems and processed through COVALYZE PartIQ. This converted previously unstructured drawings — including older documents and those with inconsistent formatting — into structured analytical data containing geometry, material, and process parameters.
Material Harmonization
Approximately 50 raw material spec variants found across drawings and ERP records were consolidated into around 10 harmonized material classes:
Technical & Commercial Analysis
Using COVALYZE Analytics, the structured technical data was combined with spend, supplier, and volume data to quantify which factors actually drove price variation across the part portfolio.
Parameters Analyzed
The analysis covered both technical and commercial variables simultaneously:
- » Piece quantity / order volume
- » Outer diameter
- » Length
- » Fillet-radius geometry
- » Surface treatment
- » Material specification
- » Supplier allocation and part fragmentation patterns
Price Driver Breakdown
Quantified to 1% accuracy — decision-grade precision for supplier negotiations:
Piece quantity alone accounted for one-third of the total price effect — confirming the intuition but turning it into an argument.
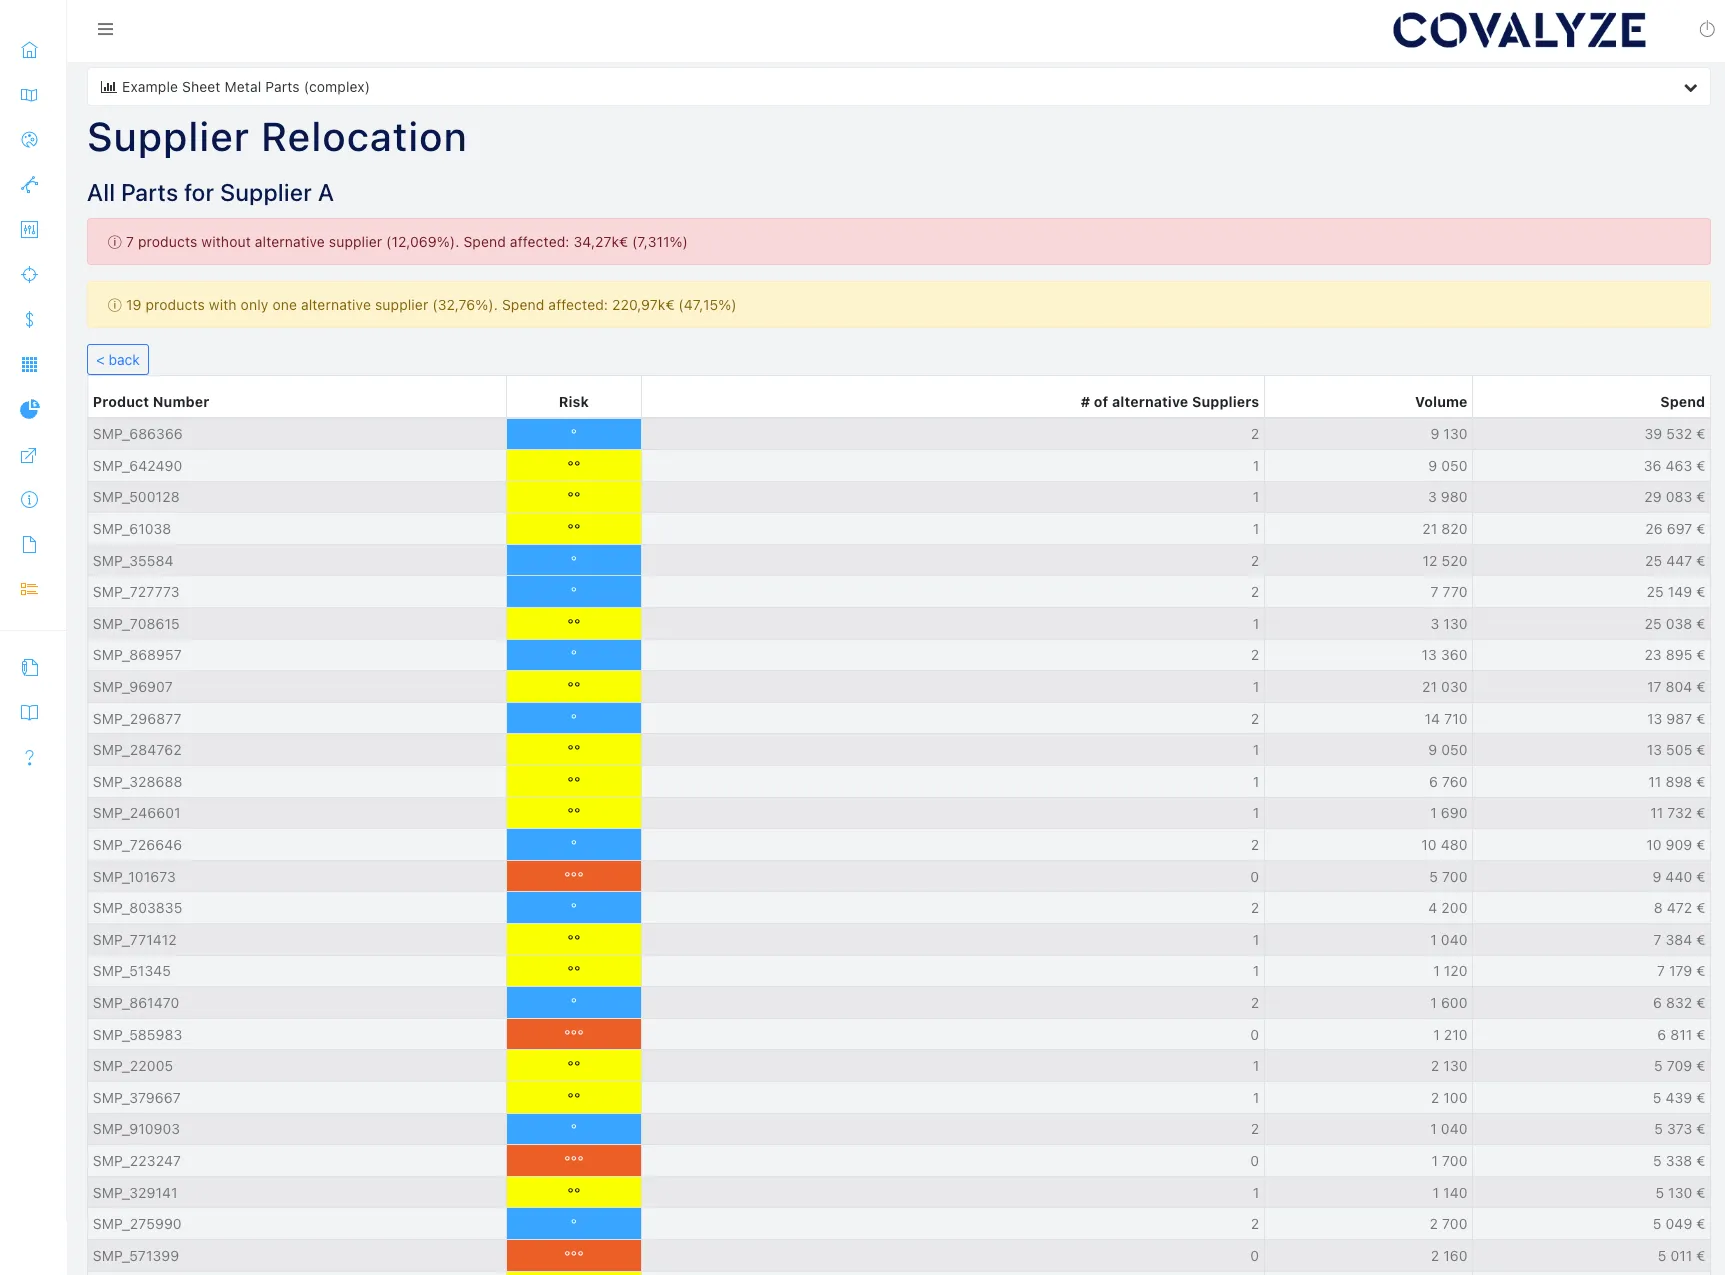
Supplier & Part Structure
The 50 parts were distributed across more than 10 suppliers. The analysis revealed how supplier fragmentation amplified the quantity disadvantage: low volumes split across many suppliers meant no single relationship was large enough to justify volume-based pricing conversations.
Low piece volumes combined with high variant diversity created penalty pricing from suppliers — a structural pattern, not a negotiation failure.
The analysis explicitly framed this as a competitive disadvantage versus higher-volume players — including Chinese manufacturers whose main edge is scale, not process superiority.
Scenario Development & Transformation Roadmap
The quantified cost-driver model immediately unlocked concrete optimization levers and pointed toward a broader transformation agenda.
Supplier renegotiation backed by quantified price-driver evidence — not intuition
Minimum-volume logic for target costing and future product planning
Evidence-based prioritization of the next categories to analyze
Beyond the Initial Scope
What started as a one-category cost exercise evolved into a broader transformation case. The findings triggered conversations at CEO, CFO, and investor level — and set the agenda for digitizing technical records enterprise-wide, expanding into welded assemblies, and replicating the approach across other PE portfolio companies.
Outcome & Impact
The Result
The project turned a fragmented, intuition-based procurement problem into a quantified decision system for sourcing, target costing, and transformation — with €29,000 in identified savings as the immediate commercial output.
What the Client Can Now Do
Decisions that were previously impossible — or based purely on experience — became evidence-based:
- » Enter supplier talks with a quantified breakdown of what drives pricing
- » Identify price outliers at part level and challenge supplier claims with data
- » Set realistic target prices and viable minimum order volumes for new products
- » Choose the next procurement categories based on evidence rather than intuition
- » Justify investment into broader technical data digitization across the plant

“With the insights from Covalyze Analysis we are able to show that the cost drivers are measurable, which means that our client now has a much stronger basis for negotiation and planning the next stage of the transformation process.” ”
Largest parts by average 3-year spend — the economically relevant core of the category.
The true scale of the part universe, far beyond the initial scope.
Based on 3-year average to account for project-driven spend volatility.
Roughly 8–10% of the analyzed annual spend, with further upside in adjacent categories.
Quantified to 1% accuracy — the single most important commercial lever identified.
Consolidated from approximately 50 raw material spec variants in the source data.
What began as a 50-part cost exercise became a transformation blueprint for the entire company — and a replicable model for the PE investor's portfolio.
From Intuition to Steering Logic
Before, procurement had a vague sense that quantity mattered. After the project, it had a quantified, decision-grade model connecting part geometry, material, volume, and expected price — and a roadmap for scaling that capability across categories, assemblies, and the broader organization. The invisible logic of supplier pricing had been made measurable and actionable.