Opening Brief
At a Glance

Our Client
Our client, an international consulting group, is supporting a global industrial technology company in reshaping its procurement organisation in order to unlock value, strengthen supplier resilience and improve performance across its complex international supply chain.
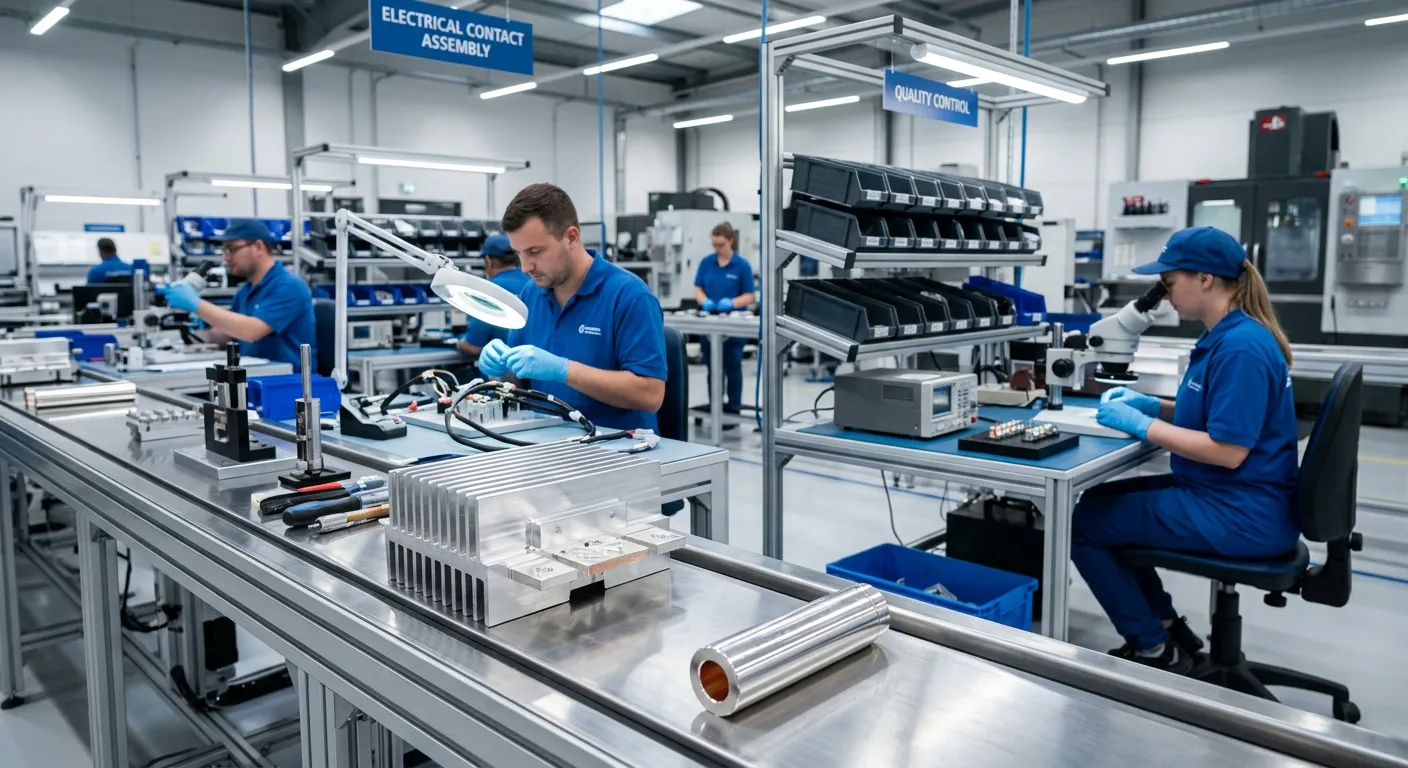
The automotive supplier required clarity on the true cost drivers behind a highly specialised group of electrical contact components. What initially appeared to be a limited dataset of 45 CAD files was found to contain technical information for 172 variants, which were hidden behind complex drawing structures, large-format documentation and embedded procurement references.
Using COVALYZE PartIQ and COVALYZE Analytics, the project team created full transparency across the technical characteristics, material composition, and cost structure of the relevant contact variants. The result was a reliable basis for supplier negotiations, material optimization, and strategic sourcing decisions.
Key Figures
Original drawing scope provided by the customer.
Technical variants discovered through extraction and detection.
Production-relevant records retained after cleansing.
Weight and material calculations resolved to fine detail.
Commercial model benchmarked across a significant sourcing volume.
Semi-finished material represented the dominant direct cost driver.
Problem Frame
The Challenge
During the initial review of the drawings for the so-called Context Contacts, the project team quickly recognized the unusual complexity of the dataset.
Embedded Drawing Complexity
Although the project scope initially included only 45 CAD files, each file contained a large amount of embedded information and additional variant numbers from the procurement system. Every drawing combined extensive technical details, including:
- » Length, width, and thickness
- » Number of customer-specific bends
- » Specific material layers
- » Surface markings
- » A defined base area
- » Production and supplier-related requirements stored as text elements directly in the drawings
Visibility Gap
Some of the files were provided in DIN A0 format and included large variant tables, making automated interpretation difficult for many existing approaches, including those that need to train on your data.
The customer needed a reliable way to turn these highly complex engineering documents into structured data and identify the actual commercial impact of raw material cost increases.

Execution Design
Our Approach
Drawing Digitalization & Feature Extraction
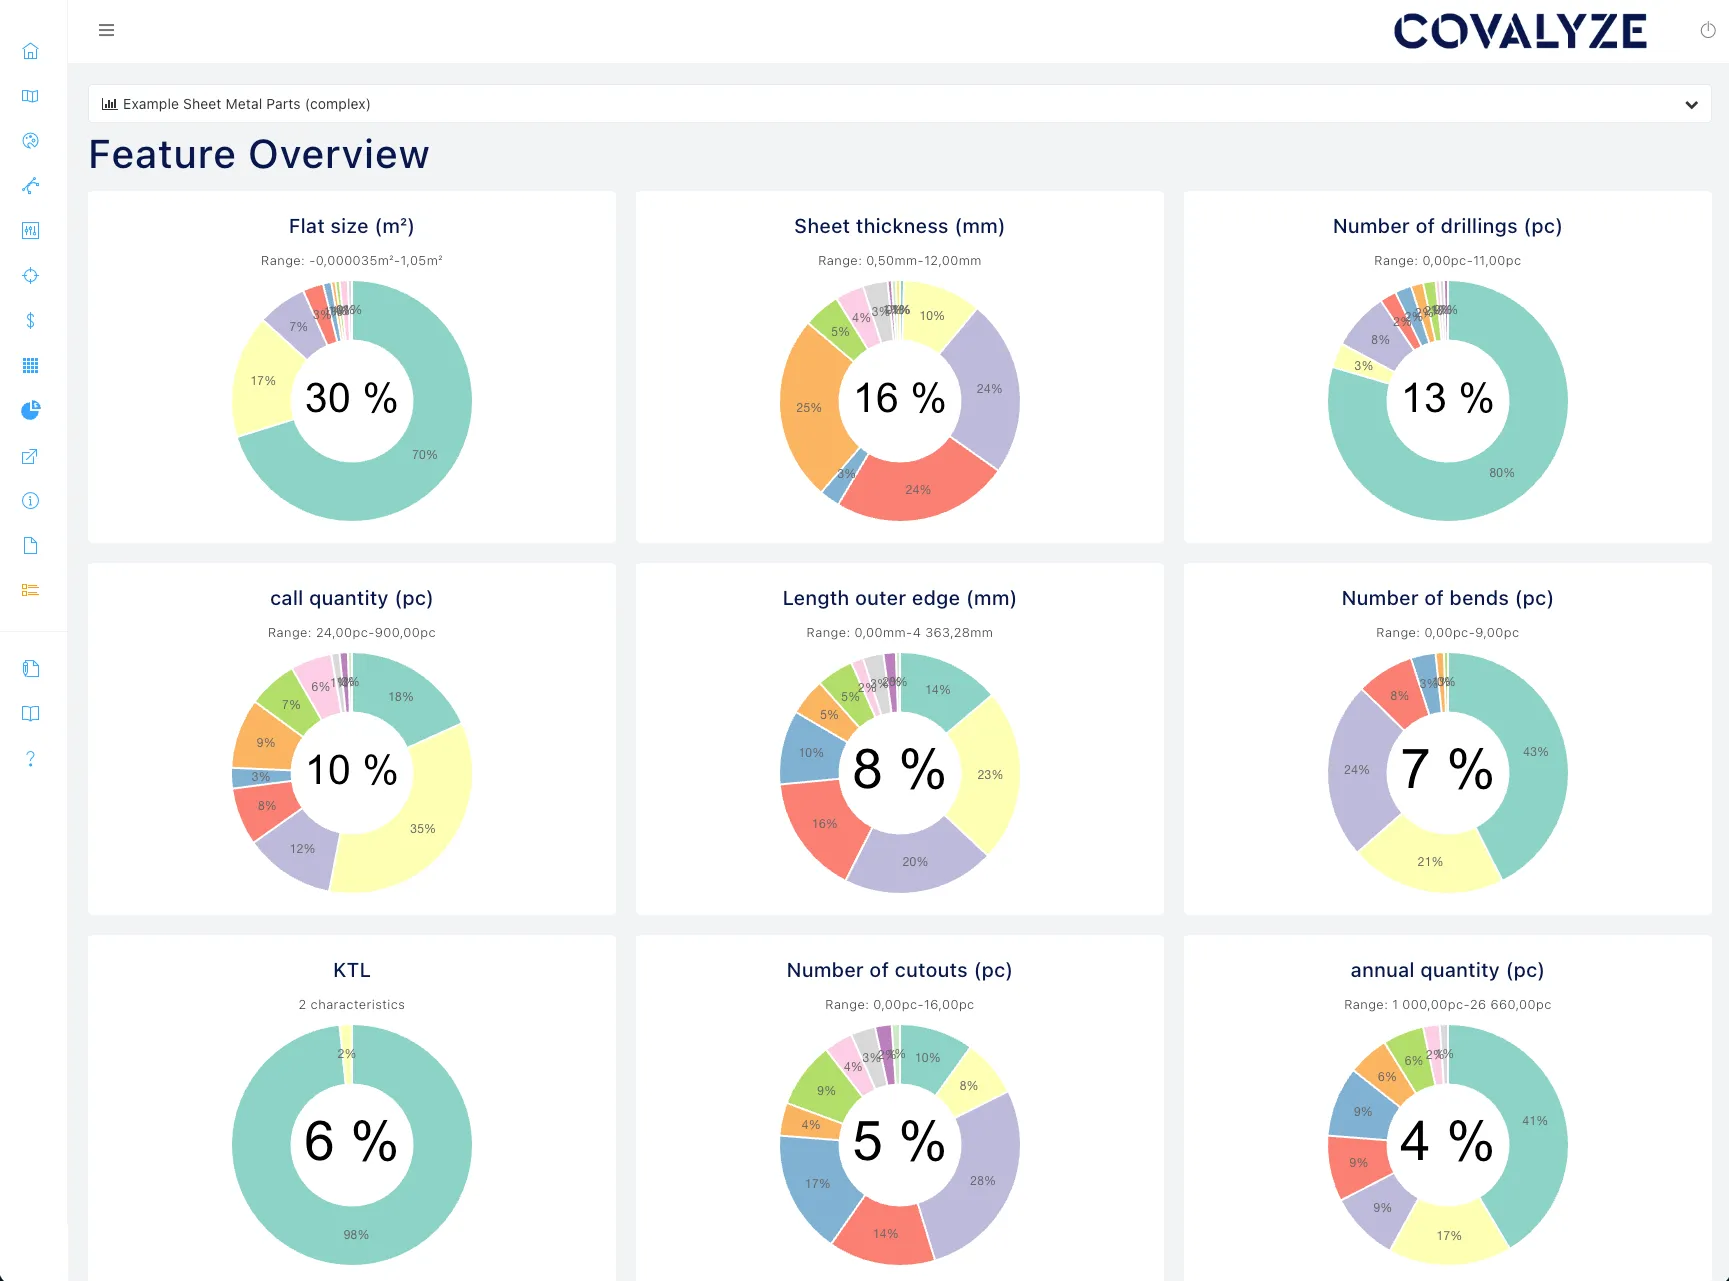
Using COVALYZE PartIQ, the project team digitalized all technical drawings and extracted structured feature data from each variant.
Variant Extraction
Through automated detection of part numbers and variants, combined with Large Document Processing, it became clear that the original 45 CAD files actually contained technical information for 172 variants.
Product Group Cleansing
After classification, the team identified 132 valid contact variants. Excluded records:
- » MRO orders (Maintenance, Repair & Operations)
- » Other unrelated product groups that had been incorrectly included in the dataset
Material Stack Validation
For each variant, the team validated the three-layer material structure:
Technical & Commercial Analysis
Using COVALYZE Analytics, the team performed a fully automated technical and commercial analysis of the extracted parameters and procurement values in a technical cost model.
Technical Cost Model
For every validated variant, the system determined:
- » Precise weight
- » Material shares
- » Component-specific raw material composition
Precision reached up to 0.01 grams — critical given the high share of silver, where even small deviations lead to significant cost effects at production scale.
Commodity Exposure
Raw material costs were benchmarked against current commodity prices. Price dynamics over the previous 12 months:
Suppliers were requesting significant price increases as raw materials became the central cost driver.
Commercial Implications
A full cost calculation across USD 12 million in procurement volume, including supplier-level margin analysis, revealed:
More than 55% of direct manufacturing costs were driven by semi-finished material costs (strip material)
Split almost evenly between:
Optimization Scenario Development
Based on the analysis, targeted optimization scenarios were developed:
Silver substitution where technically feasible
Alternative raw material sourcing through more cost-efficient supply channels
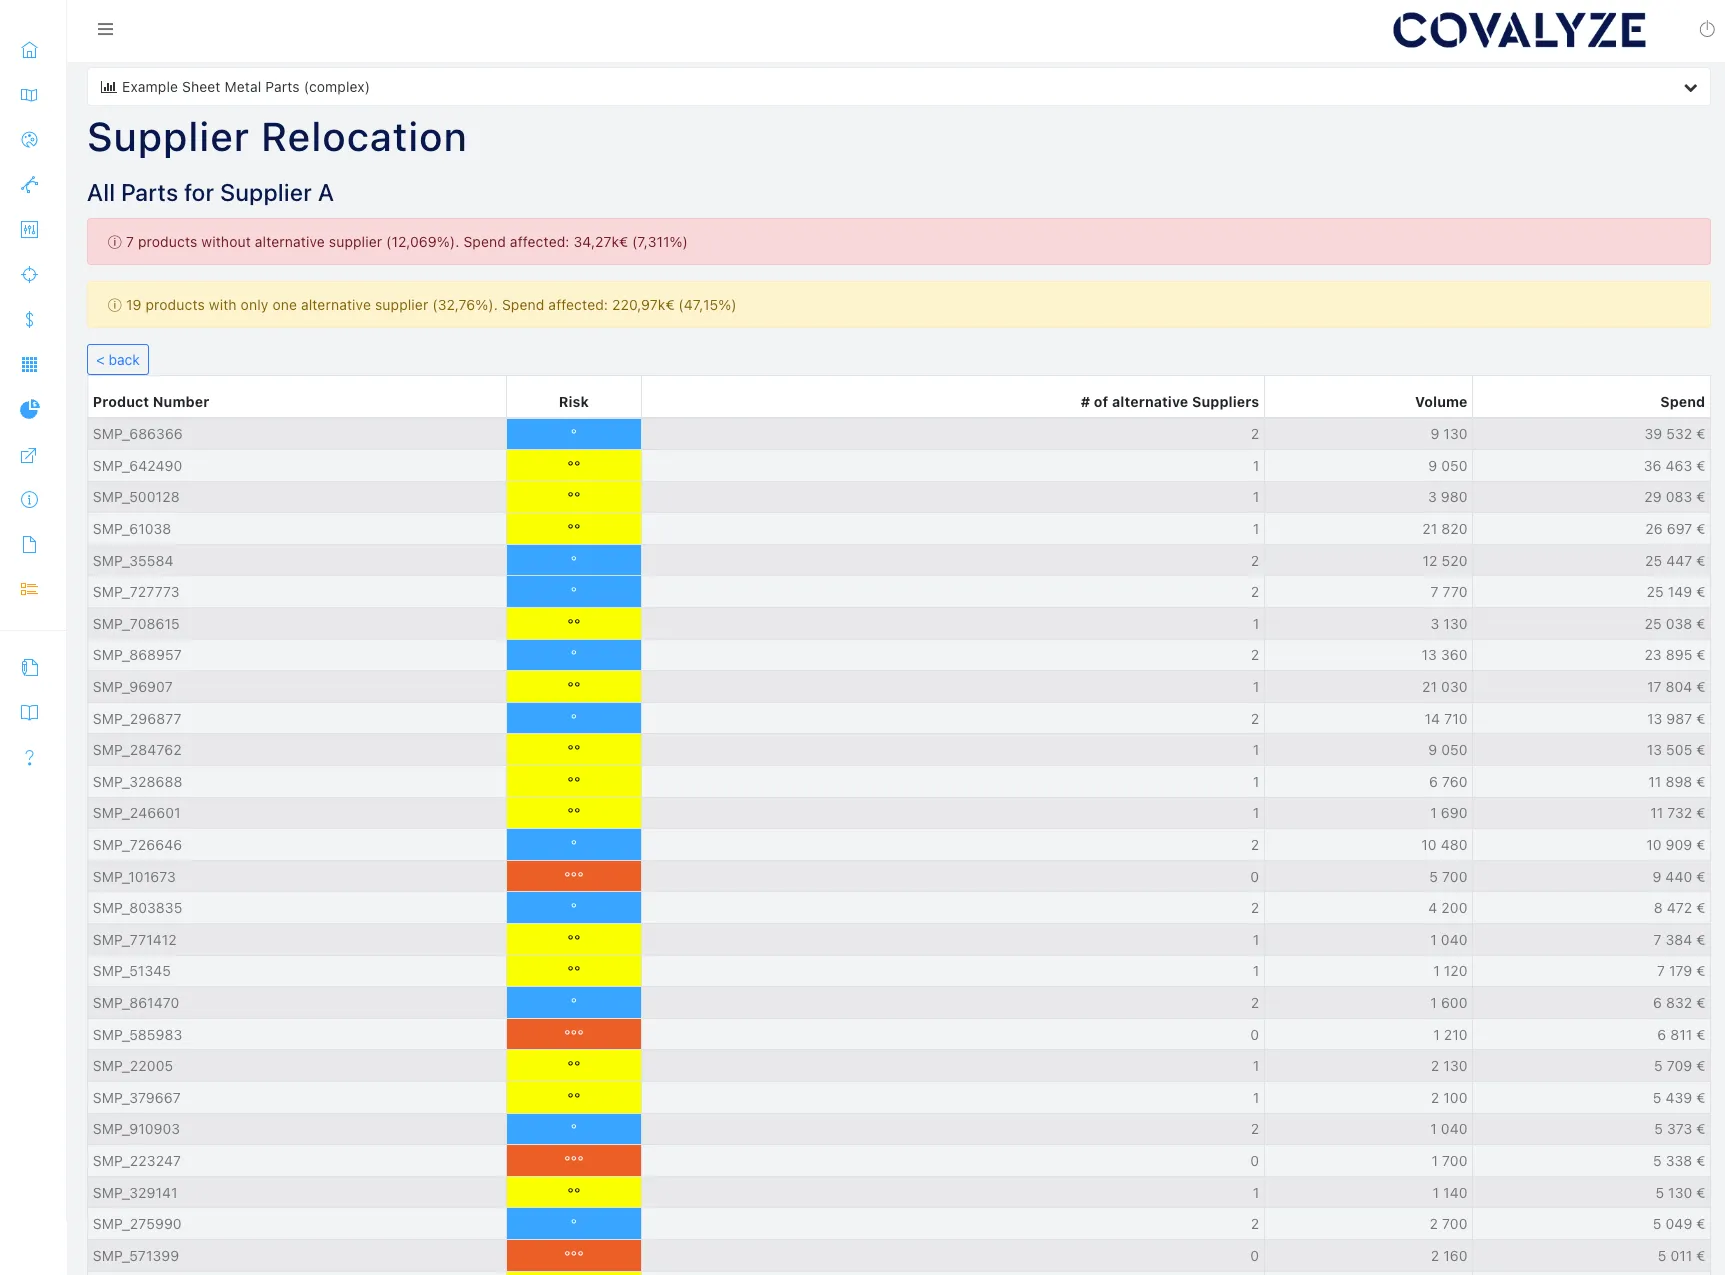
Strategic supplier base realignment, especially in light of global trade restrictions
Exposure Already Identified
Although the analyzed 45 CAD files represented only around 30% of the total product group volume, the analysis was already sufficient to uncover a multi-million-dollar cost risk.
Outcome & Impact
The Result
By combining precise technical analysis of 132 validated contact variants with a detailed material cost assessment and supplier-level commercial evaluation, the customer gained a robust basis for active price management.
Negotiation Readiness
This enabled the organization to:
- » Identify the true cost drivers behind supplier price increases
- » Strengthen its position in supplier negotiations
- » Prioritize optimization initiatives based on facts rather than assumptions
- » Actively manage raw material exposure in a highly volatile market

“We are proud to showcase that the project transformed a fragmented and difficult-to-process engineering dataset into a clear decision-making foundation for procurement, cost optimization, and strategic sourcing.”
Original drawing scope provided by the customer.
Technical variants discovered through extraction and detection.
Production-relevant records retained after cleansing.
Weight and material calculations resolved to fine detail.
Commercial model benchmarked across a significant sourcing volume.
Semi-finished material represented the dominant direct cost driver.
What began as a technical drawing analysis became a strategic cost transparency initiative.
From Technical Review to Steering Logic
With a clear understanding of geometry, material composition, and cost structure, the customer was able to move from reactive supplier discussions to fact-based price steering and targeted optimization action.